Qantas 2008 Annual Report Download - page 90
Download and view the complete annual report
Please find page 90 of the 2008 Qantas annual report below. You can navigate through the pages in the report by either clicking on the pages listed below, or by using the keyword search tool below to find specific information within the annual report.-
 1
1 -
2
-
3
-
4
-
5
-
6
-
7
-
8
-
9
-
10
-
11
-
12
-
13
-
14
-
15
-
16
-
17
-
18
-
19
-
20
-
21
-
22
-
23
-
24
-
25
-
26
-
27
-
28
-
29
-
30
-
31
-
32
-
33
-
34
-
35
-
36
-
37
-
38
-
39
-
40
-
41
-
42
-
43
-
44
-
45
-
46
-
47
-
48
-
49
-
50
-
51
-
52
-
53
-
54
-
55
-
56
-
57
-
58
-
59
-
60
-
61
-
62
-
63
-
64
-
65
-
66
-
67
-
68
-
69
-
70
-
71
-
72
-
73
-
74
-
75
-
76
-
77
-
78
-
79
-
 80
80 -
 81
81 -
 82
82 -
 83
83 -
 84
84 -
 85
85 -
 86
86 -
 87
87 -
 88
88 -
 89
89 -
 90
90 -
 91
91 -
 92
92 -
 93
93 -
 94
94 -
 95
95 -
 96
96 -
 97
97 -
 98
98 -
 99
99 -
 100
100 -
101
-
102
-
103
-
104
-
105
-
106
-
107
-
108
-
109
-
110
-
111
-
112
-
113
-
114
-
115
-
116
-
117
-
118
-
119
-
120
-
121
-
122
-
123
-
124
-
125
-
126
-
127
-
128
-
129
-
130
-
131
-
132
-
133
-
134
-
135
-
136
-
137
-
138
-
139
-
140
-
141
-
142
-
143
-
144
-
145
-
146
-
147
-
148
-
149
-
150
-
151
-
152
-
153
-
154
-
155
-
156
 |
 |

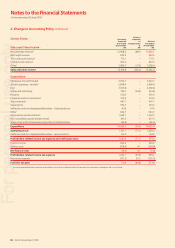
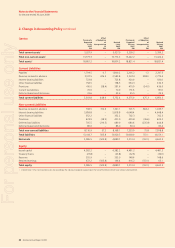
88 Qantas Annual Report 2008
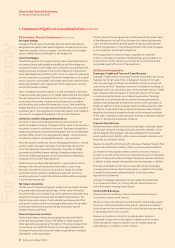
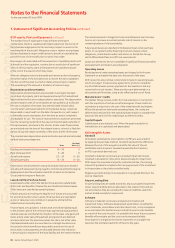
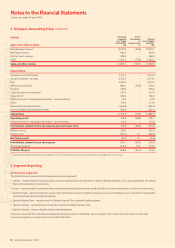
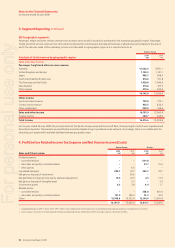
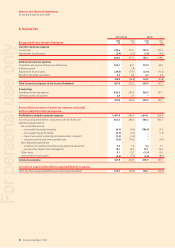
2. Change in Accounting Policy continued
Notes to the Financial Statements
for the year ended 30 June 2008
Qantas Group Previously
Reported
Year Ended
30 June 2007
$M
Effect of
Adoption
of
Interpretation
13
$M
Revised
Year Ended
30 June 2007
$M Sales and Other Income
Net passenger revenue111,9 68. 2 (48.1) 11,920.1
Net freight revenue 902.5 – 902.5
Tours and travel revenue1 775.1 – 775.1
Contract work revenue 434.3 – 434.3
Other11,086.3 (57.9) 1,028.4
Sales and other income 15,166.4 (106.0) 15,060.4
Expenditure
Manpower and staff related 3,334.7 – 3,334.7
Aircraft operating – variable1 2,608.4 – 2,608.4
Fuel 3,336.8 – 3,336.8
Selling and marketing1 726.7 (34.9) 691.8
Property 350.5 – 350.5
Computer and communication1319.5 – 319.5
Tours and travel 641.7 – 641.7
Capacity hire 303.2 – 303.2
Ineffective and non-designated derivatives – closed positions 67.6 – 67.6
Other1644.7 – 644.7
Depreciation and amortisation 1,362.7 – 1,362.7
Non-cancellable operating lease rentals 415.3 – 415.3
Share of net profi t of associates and jointly controlled entities (46.5) – (46.5)
Expenditure 14,065.3 (34.9) 14,030.4
Operating result 1,101.1 (71.1) 1,030.0
Ineffective and non-designated derivatives – open positions (54.1) – (54.1)
Profit before related income tax expense and net finance costs 1,047.0 (71.1) 975.9
Finance income 244.0 – 244.0
Finance costs (258.9) 4.1 (254.8)
Net finance costs (14.9) 4.1 (10.8)
Profit before related income tax expense 1,032.1 (67.0) 965.1
Income tax expense (312.5) 20.2 (292.3)
Profit for the year 719.6 (46.8) 672.8
Previously repor ted balances have been reclassifi ed as a result of the implementation of a common chart of accounts throughout the Qantas Group.
1
For personal use only