Qantas 2008 Annual Report Download - page 72
Download and view the complete annual report
Please find page 72 of the 2008 Qantas annual report below. You can navigate through the pages in the report by either clicking on the pages listed below, or by using the keyword search tool below to find specific information within the annual report.-
 1
1 -
2
-
3
-
4
-
5
-
6
-
7
-
8
-
9
-
10
-
11
-
12
-
13
-
14
-
15
-
16
-
17
-
18
-
19
-
20
-
21
-
22
-
23
-
24
-
25
-
26
-
27
-
28
-
29
-
30
-
31
-
32
-
33
-
34
-
35
-
36
-
37
-
38
-
39
-
40
-
41
-
42
-
43
-
44
-
45
-
46
-
47
-
48
-
49
-
50
-
51
-
52
-
53
-
54
-
55
-
56
-
57
-
58
-
59
-
60
-
61
-
 62
62 -
 63
63 -
 64
64 -
 65
65 -
 66
66 -
 67
67 -
 68
68 -
 69
69 -
 70
70 -
 71
71 -
 72
72 -
 73
73 -
 74
74 -
 75
75 -
 76
76 -
 77
77 -
 78
78 -
 79
79 -
 80
80 -
 81
81 -
 82
82 -
83
-
84
-
85
-
86
-
87
-
88
-
89
-
90
-
91
-
92
-
93
-
94
-
95
-
96
-
97
-
98
-
99
-
100
-
101
-
102
-
103
-
104
-
105
-
106
-
107
-
108
-
109
-
110
-
111
-
112
-
113
-
114
-
115
-
116
-
117
-
118
-
119
-
120
-
121
-
122
-
123
-
124
-
125
-
126
-
127
-
128
-
129
-
130
-
131
-
132
-
133
-
134
-
135
-
136
-
137
-
138
-
139
-
140
-
141
-
142
-
143
-
144
-
145
-
146
-
147
-
148
-
149
-
150
-
151
-
152
-
153
-
154
-
155
-
156
 |
 |

70 Qantas Annual Report 2008
Directors’ Report
for the year ended 30 June 2008
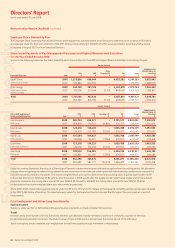
Remuneration Report (Audited) continued
Summary of Performance Conditions
Link between Remuneration Policy and Qantas’ performance
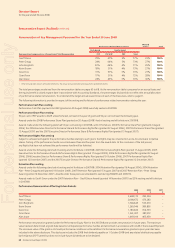
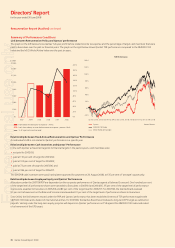
The graph on the left below shows Qantas’ full-year profi t before related income tax expense and the percentage of target cash incentives that were
paid to Executives over the past six fi nancial years. The graph on the right below shows Qantas’ TSR performance compared to the S&P/ASX 100
Index and the MSCI World Airline Index over the past six years.
Relationship between Fixed Annual Remuneration and Qantas’ Performance
An individual’s FAR is not related to Qantas’ performance in a specifi c year.
Relationship between Cash Incentives and Qantas’ Performance
In line with Qantas’ achievement against its fi nancial targets in the past six years, cash incentives were:
not paid for 2002/03;
paid at 110 per cent of target for 2003/04;
paid at 100 per cent of target for 2004/05;
paid at 73 per cent of target for 2005/06; and
paid at 186 per cent of target for 2006/07.
The 2007/08 cash incentives were paid, having been approved for payment on 20 August 2008, at 135 per cent of ‘at target’ opportunity.
Relationship between Employee Equity and Qantas’ Performance
Allocations under the 2007/08 PSP are dependent on the corporate performance of Qantas against a Balanced Scorecard. One hundred per cent
of the target level of performance shares were awarded to Executives in 2003/04 and 2004/05, 95 per cent of the target level of performance
shares were awarded to Executives in 2005/06 and 80 per cent of the target level for 2006/07. For 2007/08, the Qantas Board assessed
91 per cent achievement on the Balanced Scorecard and awarded 91 per cent of the target level of performance shares to Executives.
Since 2004, the link between reward under the PRP and Qantas’ performance has been established in terms of TSR performance against the
S&P/ASX 100 Index and a basket of international airlines. For 2007/08, the Qantas Board has introduced a long-term EPS target as outlined on
page 65. Vesting under the long-term equity program will depend on Qantas’ performance on TSR against the S&P/ASX 100 Index and extent
of achievement of the EPS target.
•
•
•
•
•
$200
$400
$600
$800
$1,000
$1,200
$1,400
$ million
$1,600
$0
2008
20072006200520042003
Profit before related income tax expense – A-IFRS
Profit from ordinary activities before income tax expense – previous GAAP
% of target cash incentives paid
200%
180%
160%
140%
120%
100%
80%
60%
40%
20%
0%
Qantas
S&P/ASX 100 Index
MSCI World Airline Index
Source: Reuters
TSR Performance
-20%
0%
20%
40%
60%
80%
100%
120%
140%
Jan 04 Jun 04Jun 03Jun 02 Jan 03 Jan 05 Jun 05 Jan 06 Jun 06 Jan 07 Jun 07 Jan 08 Jun 08
For personal use only