Qantas 2008 Annual Report Download - page 96
Download and view the complete annual report
Please find page 96 of the 2008 Qantas annual report below. You can navigate through the pages in the report by either clicking on the pages listed below, or by using the keyword search tool below to find specific information within the annual report.-
 1
1 -
2
-
3
-
4
-
5
-
6
-
7
-
8
-
9
-
10
-
11
-
12
-
13
-
14
-
15
-
16
-
17
-
18
-
19
-
20
-
21
-
22
-
23
-
24
-
25
-
26
-
27
-
28
-
29
-
30
-
31
-
32
-
33
-
34
-
35
-
36
-
37
-
38
-
39
-
40
-
41
-
42
-
43
-
44
-
45
-
46
-
47
-
48
-
49
-
50
-
51
-
52
-
53
-
54
-
55
-
56
-
57
-
58
-
59
-
60
-
61
-
62
-
63
-
64
-
65
-
66
-
67
-
68
-
69
-
70
-
71
-
72
-
73
-
74
-
75
-
76
-
77
-
78
-
79
-
80
-
81
-
82
-
83
-
84
-
85
-
 86
86 -
 87
87 -
 88
88 -
 89
89 -
 90
90 -
 91
91 -
 92
92 -
 93
93 -
 94
94 -
 95
95 -
 96
96 -
 97
97 -
 98
98 -
 99
99 -
 100
100 -
 101
101 -
 102
102 -
 103
103 -
 104
104 -
 105
105 -
 106
106 -
107
-
108
-
109
-
110
-
111
-
112
-
113
-
114
-
115
-
116
-
117
-
118
-
119
-
120
-
121
-
122
-
123
-
124
-
125
-
126
-
127
-
128
-
129
-
130
-
131
-
132
-
133
-
134
-
135
-
136
-
137
-
138
-
139
-
140
-
141
-
142
-
143
-
144
-
145
-
146
-
147
-
148
-
149
-
150
-
151
-
152
-
153
-
154
-
155
-
156
 |
 |

94 Qantas Annual Report 2008
Notes to the Financial Statements
for the year ended 30 June 2008
Qantas Group Qantas
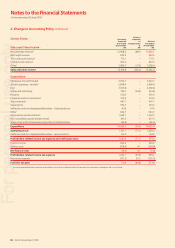
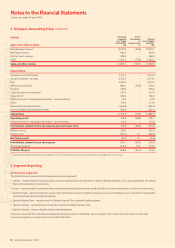
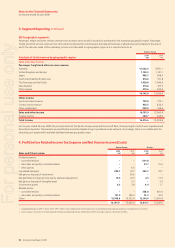
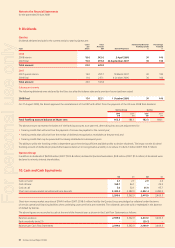
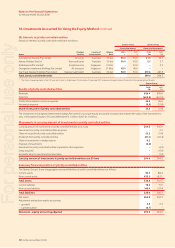
Other items included in profit before related
income tax expense and net finance income/(costs)
2008
$M
2007
$M
2008
$M
2007
$M
Equity settled share-based payments161.6 17.2 61.6 17.2
Net foreign currency loss 167.9 89.0 132.6 84.0
Bad and doubtful debts 1.9 3.7 1.5 3.7
Accelerated depreciation and impairment losses2
property, plant and equipment–118.6 –100.4 –
inventories–9.2 –8.6 –
other fi nancial assets–36.7 44.8 36.7 44.8
Provisions for freight cartel investigations363.7 47.2 63.7 47.2
Restructuring
redundancy costs–32.3 147.4 31.1 147.3
other–90.2 87.7 90.2 87.7
Cancellable operating leases 174.7 170.7 139.8 157.6
Refer to Note 24 for further details.
During the year ended 30 June 2008, the Qantas Group announced its intentions to reduce capacity on certain fl ying routes and retire certain aircraft. As a result of these announcements and
other impairment reviews, the Qantas Group recognised accelerated depreciation and impairment losses of $118.6 million (Qantas: $100.4 million) to reduce the carrying value of property,
plant and equipment and $9.2 million (Qantas: $8.6 million) to reduce certain inventories to net realisable value. This impairment loss includes $9.2 million on the write-down of property, plant
and equipment of Jet Turbine Services Pty Limited (JTS) as a result of the disposal of a 50 per cent interest to Lufthansa Technik on 1 July 2008. Impairment losses on other fi nancial assets
associated with certain fi nance lease aircraft of $36.7 million (2007: $44.8 million) were also recognised during the year.
Provisions of $63.7 million (2007: $47.2 million) were recognised for estimated liabilities associated with freight cartel investigations. Refer to Note 28 for further details.
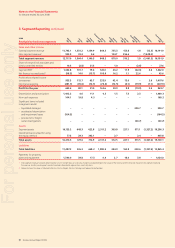
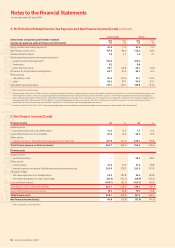
5. Net Finance Income/(Costs)
Finance income $M $M $M $M
Related parties
associates and jointly controlled entities–10.2 10.3 7.7 10.3
Unwinding of discount on receivables 22.6 16.5 22.6 16.5
Other parties
interest income on fi nancial assets measured at amortised cost–251.9 217.2 224.3 199.8
Total finance income on financial assets 284.7 244.0 254.6 226.6
Finance costs
Related parties
controlled entities–––98.5 83.0
Other parties
fi nance leases–31.2 37.4 31.2 38.8
interest expense on fi nancial liabilities measured at amortised cost–293.0 278.3 222.9 207.3
Fair value hedges1
fair value adjustments on hedged items–35.5 187.8 35.5 187.8
derivatives designated in a fair value hedge–(38.9) (192.2) (38.9) (192.2)
Less capitalised interest (100.7) (83.3) (100.7) (83.3)
Total fi nance costs on fi nancial liabilities 220.1 228.0 248.5 241.4
Unwinding of discount on provisions 19.0 26.8 19.0 26.8
Total finance costs 239.1 254.8 267.5 268.2
Net finance income/(costs) 45.6 (10.8) (12.9) (41.6)
Refer to Note 25(C) for further details.
1
2
3
1
4. Profit before Related Income Tax Expense and Net Finance Income/(Costs) continued
For personal use only