Qantas 2008 Annual Report Download - page 91
Download and view the complete annual report
Please find page 91 of the 2008 Qantas annual report below. You can navigate through the pages in the report by either clicking on the pages listed below, or by using the keyword search tool below to find specific information within the annual report.-
 1
1 -
2
-
3
-
4
-
5
-
6
-
7
-
8
-
9
-
10
-
11
-
12
-
13
-
14
-
15
-
16
-
17
-
18
-
19
-
20
-
21
-
22
-
23
-
24
-
25
-
26
-
27
-
28
-
29
-
30
-
31
-
32
-
33
-
34
-
35
-
36
-
37
-
38
-
39
-
40
-
41
-
42
-
43
-
44
-
45
-
46
-
47
-
48
-
49
-
50
-
51
-
52
-
53
-
54
-
55
-
56
-
57
-
58
-
59
-
60
-
61
-
62
-
63
-
64
-
65
-
66
-
67
-
68
-
69
-
70
-
71
-
72
-
73
-
74
-
75
-
76
-
77
-
78
-
79
-
80
-
 81
81 -
 82
82 -
 83
83 -
 84
84 -
 85
85 -
 86
86 -
 87
87 -
 88
88 -
 89
89 -
 90
90 -
 91
91 -
 92
92 -
 93
93 -
 94
94 -
 95
95 -
 96
96 -
 97
97 -
 98
98 -
 99
99 -
 100
100 -
 101
101 -
102
-
103
-
104
-
105
-
106
-
107
-
108
-
109
-
110
-
111
-
112
-
113
-
114
-
115
-
116
-
117
-
118
-
119
-
120
-
121
-
122
-
123
-
124
-
125
-
126
-
127
-
128
-
129
-
130
-
131
-
132
-
133
-
134
-
135
-
136
-
137
-
138
-
139
-
140
-
141
-
142
-
143
-
144
-
145
-
146
-
147
-
148
-
149
-
150
-
151
-
152
-
153
-
154
-
155
-
156
 |
 |

89 Qantas Annual Report 2008
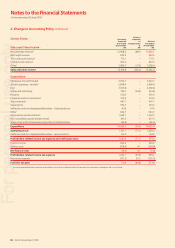
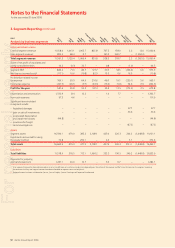
2. Change in Accounting Policy continued
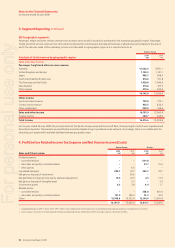
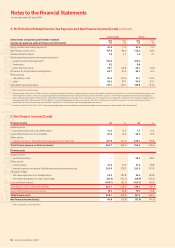
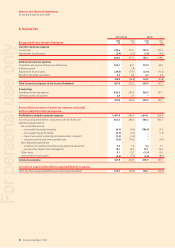
Notes to the Financial Statements
for the year ended 30 June 2008
Qantas Previously
Reported
1 July
2006
$M
Effect
of Adoption
of
Interpretation
13
$M
Revised
1 July
2006
$M
Previously
Reported
30 June
2007
$M
Effect
of Adoption
of
Interpretation
13
$M
Revised
30 June
2007
$M
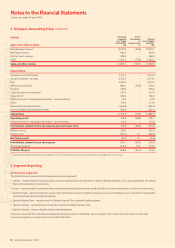
Total current assets15,027.9 – 5,027.9 5,399.2 – 5,399.2
Total non-current assets113,773.3 – 13,773.3 13,422.2 – 13,422.2
Total assets118,801.2 – 18,801.2 18,821.4 – 18,821.4
Current Liabilities
Payables 1,799.5 0.7 1,800.2 2,206.2 1.3 2,207.5
Revenue received in advance 2,107.5 476.3 2,583.8 2,267.4 508.0 2,775.4
Interest-bearing liabilities 723.8 – 723.8 920.0 – 920.0
Other fi nancial liabilities 158.5 – 158.5 334.3 – 334.3
Provisions 410.0 (28.4) 381.6 470.0 (34.0) 436.0
Current tax liabilities 70.9 – 70.9 151.6 – 151.6
Deferred lease benefi ts/income 33.6 – 33.6 25.5 – 25.5
Total current liabilities 5,303.8 448.6 5,752.4 6,375.0 475.3 6,850.3
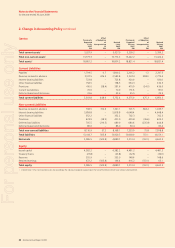
Non-current Liabilities
Revenue received in advance 708.5 312.6 1,021.1 701.5 348.2 1,049.7
Interest-bearing liabilities 5,818.8 – 5,818.8 4,648.4 – 4,648.4
Other fi nancial liabilities 352.2 – 352.2 702.3 – 702.3
Provisions 439.9 (38.9) 401.0 439.8 (36.6) 403.2
Deferred tax liabilities 705.5 (216.5) 489.0 680.6 (235.8) 444.8
Deferred lease benefi ts/income 86.0 – 86.0 60.4 – 60.4
Total non-current liabilities 8,110.9 57.2 8,168.1 7,233.0 75.8 7,308.8
Total liabilities 13,414.7 505.8 13,920.5 13,608.0 551.1 14,159.1
Net assets 5,386.5 (505.8) 4,880.7 5,213.4 (551.1) 4,662.3
Equity
Issued capital 4,382.2 – 4,382.2 4,481.2 – 4,481.2
Treasury shares (23.8) – (23.8) (32.6) – (32.6)
Reserves 355.9 – 355.9 148.6 – 148.6
Retained earnings 672.2 (505.8) 166.4 616.2 (551.1) 65.1
Total equity 5,386.5 (505.8) 4,880.7 5,213.4 (551.1) 4,662.3
Interpretation 13 has not impacted assets and accordingly the individual categories appearing on the face of the Balance Sheet have not been disclosed here.
1
For personal use only