Qantas 2008 Annual Report Download - page 89
Download and view the complete annual report
Please find page 89 of the 2008 Qantas annual report below. You can navigate through the pages in the report by either clicking on the pages listed below, or by using the keyword search tool below to find specific information within the annual report.-
 1
1 -
2
-
3
-
4
-
5
-
6
-
7
-
8
-
9
-
10
-
11
-
12
-
13
-
14
-
15
-
16
-
17
-
18
-
19
-
20
-
21
-
22
-
23
-
24
-
25
-
26
-
27
-
28
-
29
-
30
-
31
-
32
-
33
-
34
-
35
-
36
-
37
-
38
-
39
-
40
-
41
-
42
-
43
-
44
-
45
-
46
-
47
-
48
-
49
-
50
-
51
-
52
-
53
-
54
-
55
-
56
-
57
-
58
-
59
-
60
-
61
-
62
-
63
-
64
-
65
-
66
-
67
-
68
-
69
-
70
-
71
-
72
-
73
-
74
-
75
-
76
-
77
-
78
-
 79
79 -
 80
80 -
 81
81 -
 82
82 -
 83
83 -
 84
84 -
 85
85 -
 86
86 -
 87
87 -
 88
88 -
 89
89 -
 90
90 -
 91
91 -
 92
92 -
 93
93 -
 94
94 -
 95
95 -
 96
96 -
 97
97 -
 98
98 -
 99
99 -
100
-
101
-
102
-
103
-
104
-
105
-
106
-
107
-
108
-
109
-
110
-
111
-
112
-
113
-
114
-
115
-
116
-
117
-
118
-
119
-
120
-
121
-
122
-
123
-
124
-
125
-
126
-
127
-
128
-
129
-
130
-
131
-
132
-
133
-
134
-
135
-
136
-
137
-
138
-
139
-
140
-
141
-
142
-
143
-
144
-
145
-
146
-
147
-
148
-
149
-
150
-
151
-
152
-
153
-
154
-
155
-
156
 |
 |

87 Qantas Annual Report 2008
Notes to the Financial Statements
for the year ended 30 June 2008
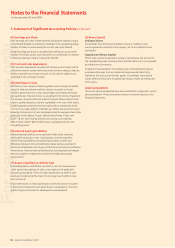
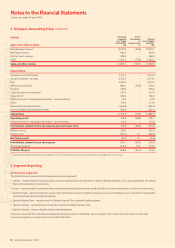
2. Change in Accounting Policy
On 1 July 2007, the Qantas Group revised its accounting policy in relation to accounting for Qantas Frequent Flyer points and their associated expiry.
This accounting policy change effects the early adoption of Interpretation 13.
The previous accounting policy created a provision for the cost of the obligation to provide travel rewards to members arising from travel on
points earning services. This provision excluded the costs of the number of points that were estimated to expire. The provision was calculated
as the present value of the expected incremental direct cost (being the cost of meals and passenger expenses) of providing the travel rewards.
The new accounting policy requires revenue received in relation to points earning fl ights to be split. The allocation between the value of the
fl ight and the value of the points awarded is undertaken at fair value. The value attributable to the fl ight is then recognised on passenger uplift,
while the value attributed to the awarded points is deferred as a liability until the points are ultimately utilised.
The value attributed to the points that are expected to expire is recognised as revenue as the risk expires i.e. based on the number of points
that have been redeemed relative to the total number expected to be redeemed.
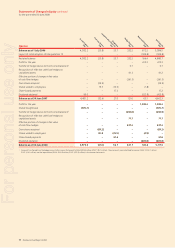
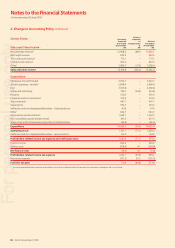
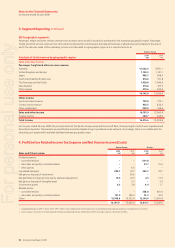
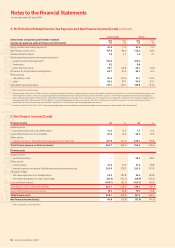
The impact of the adoption of Interpretation 13 on the Balance Sheet as at 1 July 2006 and 30 June 2007 and the Income Statement for the year
ended 30 June 2007 is shown in the following tables.
Qantas Group Previously
Reported
1 July
2006
$M
Effect
of Adoption
of
Interpretation
13
$M
Revised
1 July
2006
$M
Previously
Reported
30 June
2007
$M
Effect
of Adoption
of
Interpretation
13
$M
Revised
30 June
2007
$M
Total current assets1 4,948.4 – 4,948.4 5,587.4 – 5,587.4
Total non-current assets1 14,234.9 – 14,234.9 13,906.3 – 13,906.3
Total assets1 19,183.3 – 19,183.3 19,493.7 – 19,493.7
Current Liabilities
Payables 1,985.3 – 1,985.3 2,005.7 – 2,005.7
Revenue received in advance 2,282.8 481.0 2,763.8 2,533.6 515.7 3,049.3
Interest-bearing liabilities 440.8 – 440.8 863.7 – 863.7
Other fi nancial liabilities 139.2 – 139.2 337.2 – 337.2
Provisions 469.0 (28.4) 440.6 534.4 (34.0) 500.4
Current tax liabilities 72.4 – 72.4 153.6 – 153.6
Deferred lease benefi ts/income 37.5 – 37.5 29.3 – 29.3
Total current liabilities 5,427.0 452.6 5,879.6 6,457.5 481.7 6,939.2
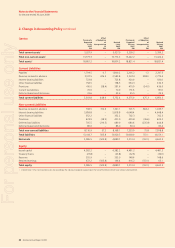
Non-current Liabilities
Revenue received in advance 708.5 312.6 1,021.1 701.5 348.2 1,049.7
Interest-bearing liabilities 5,334.8 – 5,334.8 4,210.9 – 4,210.9
Other fi nancial liabilities 352.2 – 352.2 702.3 – 702.3
Provisions 479.7 (38.9) 440.8 481.9 (36.6) 445.3
Deferred tax liabilities 701.2 (217.9) 483.3 675.6 (238.1) 437.5
Deferred lease benefi ts/income 98.8 – 98.8 69.0 – 69.0
Total non-current liabilities 7,675.2 55.8 7,731.0 6,841.2 73.5 6,914.7
Total liabilities 13,102.2 508.4 13,610.6 13,298.7 555.2 13,853.9
Net assets 6,081.1 (508.4) 5,572.7 6,195.0 (555.2) 5,639.8
Equity
Issued capital 4,382.2 – 4,382.2 4,481.2 – 4,481.2
Treasury shares (23.8) – (23.8) (32.6) – (32.6)
Reserves 329.3 – 329.3 148.2 – 148.2
Retained earnings 1,388.5 (508.4) 880.1 1,593.3 (555.2) 1,038.1
Equity attributable to members of Qantas 6,076.2 (508.4) 5,567.8 6,190.1 (555.2) 5,634.9
Minority interest 4.9 – 4.9 4.9 – 4.9
Total equity 6,081.1 (508.4) 5,572.7 6,195.0 (555.2) 5,639.8
Interpretation 13 has not impacted assets and accordingly the individual categories appearing on the face of the Balance Sheet have not been disclosed here.
1
For personal use only