Qantas 2008 Annual Report Download - page 137
Download and view the complete annual report
Please find page 137 of the 2008 Qantas annual report below. You can navigate through the pages in the report by either clicking on the pages listed below, or by using the keyword search tool below to find specific information within the annual report.-
 1
1 -
2
-
3
-
4
-
5
-
6
-
7
-
8
-
9
-
10
-
11
-
12
-
13
-
14
-
15
-
16
-
17
-
18
-
19
-
20
-
21
-
22
-
23
-
24
-
25
-
26
-
27
-
28
-
29
-
30
-
31
-
32
-
33
-
34
-
35
-
36
-
37
-
38
-
39
-
40
-
41
-
42
-
43
-
44
-
45
-
46
-
47
-
48
-
49
-
50
-
51
-
52
-
53
-
54
-
55
-
56
-
57
-
58
-
59
-
60
-
61
-
62
-
63
-
64
-
65
-
66
-
67
-
68
-
69
-
70
-
71
-
72
-
73
-
74
-
75
-
76
-
77
-
78
-
79
-
80
-
81
-
82
-
83
-
84
-
85
-
86
-
87
-
88
-
89
-
90
-
91
-
92
-
93
-
94
-
95
-
96
-
97
-
98
-
99
-
100
-
101
-
102
-
103
-
104
-
105
-
106
-
107
-
108
-
109
-
110
-
111
-
112
-
113
-
114
-
115
-
116
-
117
-
118
-
119
-
120
-
121
-
122
-
123
-
124
-
125
-
126
-
 127
127 -
 128
128 -
 129
129 -
 130
130 -
 131
131 -
 132
132 -
 133
133 -
 134
134 -
 135
135 -
 136
136 -
 137
137 -
 138
138 -
 139
139 -
 140
140 -
 141
141 -
 142
142 -
 143
143 -
 144
144 -
 145
145 -
 146
146 -
 147
147 -
148
-
149
-
150
-
151
-
152
-
153
-
154
-
155
-
156
 |
 |

135 Qantas Annual Report 2008
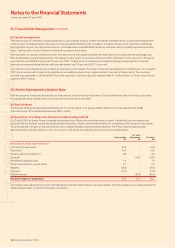
Notes to the Financial Statements
for the year ended 30 June 2008
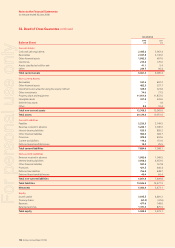
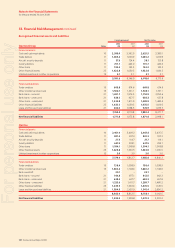
Consolidated
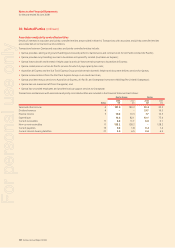
Balance Sheet 2008
$M
2007
$M
Current Assets
Cash and cash equivalents 2,445.2 3,363.4
Receivables 2,337.8 2,142.6
Other fi nancial assets 1,082.3 607.0
Inventories 210.2 176.6
Assets classifi ed as held for sale 41.1 5.4
Other 244.7 90.4
Total current assets 6,361.3 6,385.4
Non-current Assets
Receivables 531.6 402.2
Other fi nancial assets 462.3 537.7
Investments accounted for using the equity method 329.0 323.8
Other investments 74.0 77.5
Property, plant and equipment 11,951.6 11,872.6
Intangible assets 411.5 339.6
Deferred tax assets –1.8
Other 8.3 10.4
Total non-current assets 13,768.3 13,565.6
Total assets 20,129.6 19,951.0
Current Liabilities
Payables 2,220.3 2,149.5
Revenue received in advance 3,266.1 3,045.0
Interest-bearing liabilities 633.5 820.2
Other fi nancial liabilities 960.0 383.7
Provisions 479.5 492.6
Current tax liabilities 110.2 151.6
Deferred lease benefi ts/income 15.0 25.5
Total current liabilities 7,684.6 7,068.1
Non-current Liabilities
Revenue received in advance 1,082.6 1,049.5
Interest-bearing liabilities 3,958.3 4,653.0
Other fi nancial liabilities 597.3 767.8
Provisions 421.5 440.4
Deferred tax liabilities 756.5 438.7
Deferred lease benefi ts/income 45.4 60.4
Total non-current liabilities 6,861.6 7,409.8
Total liabilities 14,546.2 14,477.9
Net assets 5,583.4 5,473.1
Equity
Issued capital 3,975.5 4,481.2
Treasury shares (61.0) (32.6)
Reserves 477.6 148.6
Retained earnings 1,191.3 875.9
Total equity 5,583.4 5,473.1
32. Deed of Cross Guarantee continued
For personal use only