Qantas 2008 Annual Report Download - page 139
Download and view the complete annual report
Please find page 139 of the 2008 Qantas annual report below. You can navigate through the pages in the report by either clicking on the pages listed below, or by using the keyword search tool below to find specific information within the annual report.-
 1
1 -
2
-
3
-
4
-
5
-
6
-
7
-
8
-
9
-
10
-
11
-
12
-
13
-
14
-
15
-
16
-
17
-
18
-
19
-
20
-
21
-
22
-
23
-
24
-
25
-
26
-
27
-
28
-
29
-
30
-
31
-
32
-
33
-
34
-
35
-
36
-
37
-
38
-
39
-
40
-
41
-
42
-
43
-
44
-
45
-
46
-
47
-
48
-
49
-
50
-
51
-
52
-
53
-
54
-
55
-
56
-
57
-
58
-
59
-
60
-
61
-
62
-
63
-
64
-
65
-
66
-
67
-
68
-
69
-
70
-
71
-
72
-
73
-
74
-
75
-
76
-
77
-
78
-
79
-
80
-
81
-
82
-
83
-
84
-
85
-
86
-
87
-
88
-
89
-
90
-
91
-
92
-
93
-
94
-
95
-
96
-
97
-
98
-
99
-
100
-
101
-
102
-
103
-
104
-
105
-
106
-
107
-
108
-
109
-
110
-
111
-
112
-
113
-
114
-
115
-
116
-
117
-
118
-
119
-
120
-
121
-
122
-
123
-
124
-
125
-
126
-
127
-
128
-
 129
129 -
 130
130 -
 131
131 -
 132
132 -
 133
133 -
 134
134 -
 135
135 -
 136
136 -
 137
137 -
 138
138 -
 139
139 -
 140
140 -
 141
141 -
 142
142 -
 143
143 -
 144
144 -
 145
145 -
 146
146 -
 147
147 -
 148
148 -
 149
149 -
150
-
151
-
152
-
153
-
154
-
155
-
156
 |
 |

137 Qantas Annual Report 2008
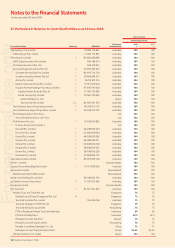
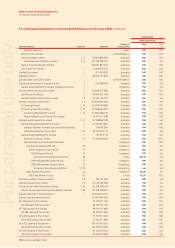
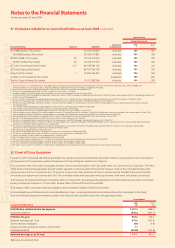
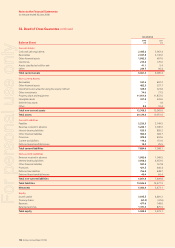
Notes to the Financial Statements
for the year ended 30 June 2008
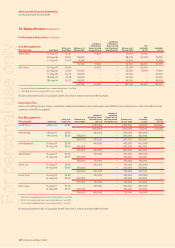
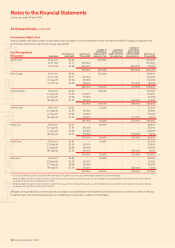
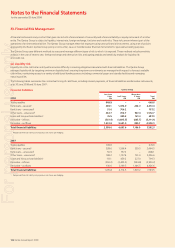
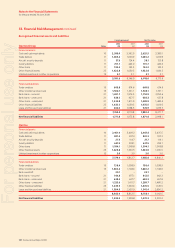
33. Financial Risk Management continued
Financial liabilities Qantas
2008
Less than
1 Year
$M
1 to 5 Years
$M
More than
5 Years
$M
Total
$M
Trade payables 738.4 – – 738.4
Bank loans – secured1134.4 637.0 134.8 906.2
Bank loans – unsecured151.0 706.2 – 757.2
Other loans – unsecured1302.7 702.7 567.3 1,572.7
Lease and hire purchase liabilities1308.0 1,673.0 284.7 2,265.7
Derivative – infl ows (551.9) (1,893.5) (665.7) (3,111.1)
Derivative – outfl ows 1,451.8 2,651.0 890.7 4,993.5
Total financial liabilities 2,434.4 4,476.4 1,211.8 8,122.6
Recognised fi nancial liability carrying values are shown pre-hedging.
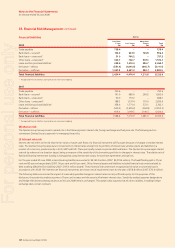
2007
Trade payables 790.6 – – 790.6
Bank loans – secured1141.9 689.6 260.5 1,092.0
Bank loans – unsecured150.9 757.2 – 808.1
Other loans – unsecured1188.2 1,137.4 701.0 2,026.6
Lease and hire purchase liabilities1358.6 1,771.4 572.1 2,702.1
Derivative – infl ows (550.2) (2,405.2) (994.8) (3,950.2)
Derivative – outfl ows 608.4 3,169.5 1,146.5 4,924.4
Total financial liabilities 1,588.4 5,119.9 1,685.3 8,393.6
Recognised fi nancial liability carrying values are shown pre-hedging.
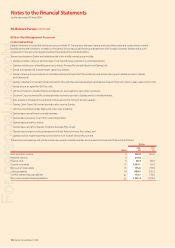
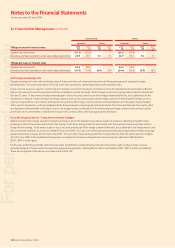
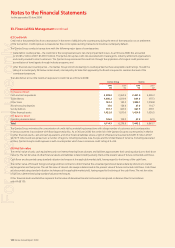
(B) Market risk
The Qantas Group has exposure to market risk in the following areas: interest rate, foreign exchange and fuel price risk. The following section
summarises Qantas Group’s approach to managing these risks.
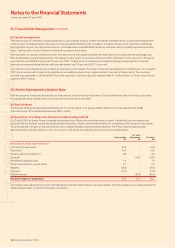
(i) Interest rate risk
Interest rate risk refers to the risk that the fair value or future cash fl ows of a fi nancial instrument will fl uctuate because of changes in market interest
rates. The Qantas Group has exposure to movements in interest rates arising from its portfolio of interest rate sensitive assets and liabilities in a
number of currencies, predominantly in AUD, GBP and EUR. These principally include corporate debt and leases. The Qantas Group manages interest
rate risk by reference to a duration target, being a measure of the sensitivity of the borrowing portfolio to changes in interest rates. The relative mix of
fi xed and fl oating interest rate funding is managed by using interest rate swaps, forward rate agreements and options.
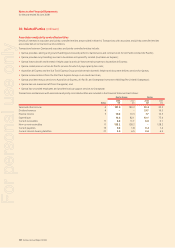
For the year ended 30 June 2008, interest-bearing liabilities amounted to $4,160.0 million (2007: $5,074.6 million). The fi xed/fl oating split is 37 per
cent and 63 per cent respectively (2007: 50 per cent and 50 per cent). Other fi nancial assets and liabilities included fi nancial instruments related to
debt totalling $244.8 million (liability) (2007: $195.6 million (asset)). These fi nancial instruments are recognised at fair value or amortised cost in
accordance with AASB 139. Interest rate fi nancial instruments are shown net of impairment losses for the year of $58.8 million (2007: $70.6 million).
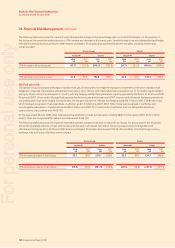
The following table summarises the impact of reasonably possible changes in interest rates on net profi t and equity. For the purposes of this
disclosure, the sensitivity analysis assumes a 10 per cent increase and decrease in all relevant interest rates. Sensitivity analysis assumes designations
and hedge effectiveness testing results as at 30 June 2008 remain unchanged. This analysis also assumes that all other variables, including foreign
exchange rates, remain constant.
1
1
For personal use only