Qantas 2008 Annual Report Download - page 80
Download and view the complete annual report
Please find page 80 of the 2008 Qantas annual report below. You can navigate through the pages in the report by either clicking on the pages listed below, or by using the keyword search tool below to find specific information within the annual report.-
 1
1 -
2
-
3
-
4
-
5
-
6
-
7
-
8
-
9
-
10
-
11
-
12
-
13
-
14
-
15
-
16
-
17
-
18
-
19
-
20
-
21
-
22
-
23
-
24
-
25
-
26
-
27
-
28
-
29
-
30
-
31
-
32
-
33
-
34
-
35
-
36
-
37
-
38
-
39
-
40
-
41
-
42
-
43
-
44
-
45
-
46
-
47
-
48
-
49
-
50
-
51
-
52
-
53
-
54
-
55
-
56
-
57
-
58
-
59
-
60
-
61
-
62
-
63
-
64
-
65
-
66
-
67
-
68
-
69
-
 70
70 -
 71
71 -
 72
72 -
 73
73 -
 74
74 -
 75
75 -
 76
76 -
 77
77 -
 78
78 -
 79
79 -
 80
80 -
 81
81 -
 82
82 -
 83
83 -
 84
84 -
 85
85 -
 86
86 -
 87
87 -
 88
88 -
 89
89 -
 90
90 -
91
-
92
-
93
-
94
-
95
-
96
-
97
-
98
-
99
-
100
-
101
-
102
-
103
-
104
-
105
-
106
-
107
-
108
-
109
-
110
-
111
-
112
-
113
-
114
-
115
-
116
-
117
-
118
-
119
-
120
-
121
-
122
-
123
-
124
-
125
-
126
-
127
-
128
-
129
-
130
-
131
-
132
-
133
-
134
-
135
-
136
-
137
-
138
-
139
-
140
-
141
-
142
-
143
-
144
-
145
-
146
-
147
-
148
-
149
-
150
-
151
-
152
-
153
-
154
-
155
-
156
 |
 |

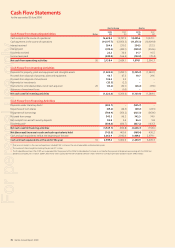
78 Qantas Annual Report 2008
Cash Flow Statements
for the year ended 30 June 2008
Qantas Group Qantas
Cash Flows from Operating Activities Notes
2008
$M
2007
$M
2008
$M
2007
$M
Cash receipts in the course of operations116,628.3 15,707.3 13,495.6 13,521.1
Cash payments in the course of operations (14,077.7) (12,956.3) (11,275.3) (10,929.8)
Interest received 264.6 230.2 234.5 212.5
Interest paid (419.3) (425.1) (349.2) (353.6)
Dividends received 22.3 34.4 21.7 16.5
Income taxes paid (289.8) (166.4) (153.2) (70.4)
Net cash from operating activities 26 2,128.4 2,424.1 1,974.1 2,396.3
Cash Flows from Investing Activities
Payments for property, plant and equipment and intangible assets (1,424.0) (1,282.1) (1,325.3) (1,240.1)
Proceeds from disposal of property, plant and equipment 43.7 47.3 19.7 29.6
Proceeds from disposal of investment 106.2 3.2 ––
Payments for investments (35.3) (2.2) ––
Payments for controlled entities, net of cash acquired 26 (13.2) (32.1) (28.2) (37.6)
Advances of investment loans –(0.5) ––
Net cash used in investing activities (1,322.6) (1,266.4) (1,333.8) (1,248.1)
Cash Flows from Financing Activities
Payments under share buy-back2(505.7) –(505.7) –
Repurchase of own shares (69.2) (24.5) (69.2) (24.5)
Repayment of borrowings (784.9) (356.2) (825.3) (363.6)
Proceeds from swaps 342.3 96.2 342.3 74.0
Net receipts from aircraft security deposits 85.8 2.4 86.4 9.8
Dividends paid3(638.0) (414.7) (637.2) (413.7)
Net cash used in financing activities (1,569.7) (696.8) (1,608.7) (718.0)
Net (decrease)/increase in cash and cash equivalents held (763.9) 460.9 (968.4) 430.2
Cash and cash equivalents held at the beginning of the year 3,362.9 2,902.0 3,409.3 2,979.1
Cash and cash equivalents at the end of the year 10 2,599.0 3,362.9 2,440.9 3,409.3
Prior year cash receipts in the course of operations included $188.1 million on the sale of expendable and recoverable spares.
The number of shares bought back during the year was 91.1 million.
The Dividend Reinvestment Plan (DRP) was suspended after the payment of the 2006 fi nal dividend but has been re-instated for the payment of dividends commencing with the 2008 fi nal
dividend. During the year, nil (2007: 28,991,867) shares were issued under the DRP. Dividends settled in shares rather than cash during the year totalled nil (2007: $99.0 million).
1
2
3
For personal use only