Qantas 2008 Annual Report Download - page 54
Download and view the complete annual report
Please find page 54 of the 2008 Qantas annual report below. You can navigate through the pages in the report by either clicking on the pages listed below, or by using the keyword search tool below to find specific information within the annual report.-
 1
1 -
2
-
3
-
4
-
5
-
6
-
7
-
8
-
9
-
10
-
11
-
12
-
13
-
14
-
15
-
16
-
17
-
18
-
19
-
20
-
21
-
22
-
23
-
24
-
25
-
26
-
27
-
28
-
29
-
30
-
31
-
32
-
33
-
34
-
35
-
36
-
37
-
38
-
39
-
40
-
41
-
42
-
43
-
 44
44 -
 45
45 -
 46
46 -
 47
47 -
 48
48 -
 49
49 -
 50
50 -
 51
51 -
 52
52 -
 53
53 -
 54
54 -
 55
55 -
 56
56 -
 57
57 -
 58
58 -
 59
59 -
 60
60 -
 61
61 -
 62
62 -
 63
63 -
 64
64 -
65
-
66
-
67
-
68
-
69
-
70
-
71
-
72
-
73
-
74
-
75
-
76
-
77
-
78
-
79
-
80
-
81
-
82
-
83
-
84
-
85
-
86
-
87
-
88
-
89
-
90
-
91
-
92
-
93
-
94
-
95
-
96
-
97
-
98
-
99
-
100
-
101
-
102
-
103
-
104
-
105
-
106
-
107
-
108
-
109
-
110
-
111
-
112
-
113
-
114
-
115
-
116
-
117
-
118
-
119
-
120
-
121
-
122
-
123
-
124
-
125
-
126
-
127
-
128
-
129
-
130
-
131
-
132
-
133
-
134
-
135
-
136
-
137
-
138
-
139
-
140
-
141
-
142
-
143
-
144
-
145
-
146
-
147
-
148
-
149
-
150
-
151
-
152
-
153
-
154
-
155
-
156
 |
 |

52 Qantas Annual Report 2008
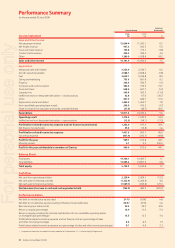
Review of Income Statement
Profi t before related income tax expense (PBT) was $1,407.6 million,
an increase of $442.5 million or 45.9 per cent. Profi t attributable
to members of Qantas was $969.0 million. This was achieved on
a 4.0 per cent increase in capacity and a robust demand environment
during the fi rst three quarters of the year in both domestic and
international markets despite strong competition and higher fuel prices.
PBT for Qantas operations (including QantasLink) totalled $935.3
million, an increase of $166.2 million. Net passenger revenue
increased by 2.9 per cent refl ecting an increase in seat factor to 81.4
per cent. Capacity decreased in the international market as
a result of shifting some services to Jetstar. Domestically, QantasLink
thrived on the introduction and the full year benefi t of three new
Q400 aircraft.
Jetstar recorded a PBT result of $115.7 million, an increase of $33.8
million. Passenger revenue increased by $366.5 million or 35.8 per
cent, largely driven by a 44.1 per cent increase in capacity, arising from
the continued expansion of the Jetstar International network. Costs
increased in line with increased activity and higher fuel prices.
PBT for the portfolio businesses totalled of $353.0 million. Qantas
Frequent Flyer was the largest contributor to the portfolio businesses
with PBT of $233.9 million in the current year. This was an
improvement of $23.3 million compared to the prior year.
A number of non-operating items were included in the results for
the year. These items were liquidated damages of $290.7 million,
freight cartel provisions of $63.7 million and accelerated depreciation
and asset write-downs of $164.5 million.
Review of Sales and Other Income
Total sales and other income for the year increased by $1,131.5 million
to $16.2 billion, an increase of 7.5 per cent on the prior year.
Net passenger revenue increased by $744.3 million or 6.2 per cent
to $12.7 billion. This refl ected capacity growth of 4.0 per cent,
a seat factor improvement of 0.8 percentage points and a yield
increase of 1.2 per cent.
Other revenue categories increased by $387.2 million to $3.5 billion,
an increase of 12.3 per cent. This was primarily due to the recognition
of liquidated damages as well as increases in freight revenue.
•
•
•
•
•
•
•
•
Review of Expenditure
Total expenditure, including net fi nancing costs and ineffective and
non-designated derivatives – open positions, increased by $689.0
million or 4.9 per cent to $14.8 billion.
Net expenditure cost per ASK decreased despite fuel cost increases.
Underlying unit costs decreased by 2.3 per cent.
Manpower and staff related expenditure increased by $198.7 million
or 6.0 per cent to $3.5 billion. Activity growth and Enterprise
Bargaining Agreement (EBA) and salary increases were offset
by SFP benefi ts.
Aircraft operating variable costs decreased by $20.3 million or
0.8 per cent to $2.6 billion largely due to reductions in aircraft
operating expenses, offset by increases in landing fees.
Fuel costs increased by $265.3 million or 8.0 per cent. The into-plane
fuel price after hedging increased by 15.5 per cent. The volume of
barrels consumed increased by 3.9 per cent in line with higher fl ying
hours, increasing costs by $141.7 million. The volume increase would
have been $60 million higher had it not been for fuel conservation
SFP initiatives delivered during the year. Stronger Australian currency
movements reduced fuel costs by $430.6 million.
Selling and marketing expenditure increased by $63.8 million
or 9.2 per cent due to increased marketing of both Jetstar and
Qantas brands offset by SFP benefi ts on selling costs.
Property costs decreased by $4.1 million or 1.2 per cent, mainly due
to onerous lease provisions recognised against vacant properties
in the prior year. This was partly offset by higher rental prices and
hangar modifi cations to accommodate A380 aircraft.
Computer and communication costs increased by $62.9 million or
19.7 per cent. This included an increase in outsourced Application
Support costs partially offset by savings in manpower costs. Price
increases, business growth and projects such as qantas.com, also
added to costs which were partially offset by SFP benefi ts.
•
•
•
•
•
•
•
•
Discussion and Analysis of the Income Statement
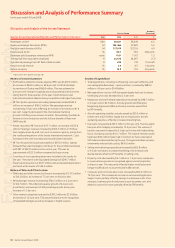
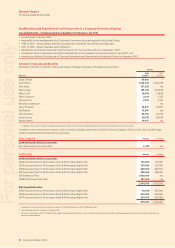
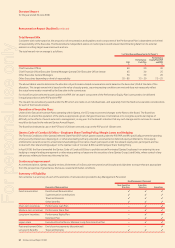
Qantas Group Operational Statistics and Performance Indicators1
Qantas Group
Increase/
(Decrease)
Unit 2008 2007 %
Passengers carried 000 38,621 36,449 6.0
Revenue passenger kilometres (RPKs) M 102,466 97,622 5.0
Available seat kilometres (ASKs) M 127,019 122,119 4.0
Revenue seat factor % 80.7 79.9 0.8 points
Passenger yield (passenger revenue per RPK) cents 11.81 11.67 1. 2
Average full-time equivalent employees # 33,670 34,267 (1.7)
Operational passenger aircraft fl eet at balance date # 224 213 11 aircraft
Return on total revenue % 5.9 4.5 1.4 points
Return on equity %16.9 11.9 5.0 point s
A glossary of terms appears on page 152.
1
Discussion and Analysis of Performance Summary
for the year ended 30 June 2008
For personal use only