Qantas 2008 Annual Report Download - page 107
Download and view the complete annual report
Please find page 107 of the 2008 Qantas annual report below. You can navigate through the pages in the report by either clicking on the pages listed below, or by using the keyword search tool below to find specific information within the annual report.-
 1
1 -
2
-
3
-
4
-
5
-
6
-
7
-
8
-
9
-
10
-
11
-
12
-
13
-
14
-
15
-
16
-
17
-
18
-
19
-
20
-
21
-
22
-
23
-
24
-
25
-
26
-
27
-
28
-
29
-
30
-
31
-
32
-
33
-
34
-
35
-
36
-
37
-
38
-
39
-
40
-
41
-
42
-
43
-
44
-
45
-
46
-
47
-
48
-
49
-
50
-
51
-
52
-
53
-
54
-
55
-
56
-
57
-
58
-
59
-
60
-
61
-
62
-
63
-
64
-
65
-
66
-
67
-
68
-
69
-
70
-
71
-
72
-
73
-
74
-
75
-
76
-
77
-
78
-
79
-
80
-
81
-
82
-
83
-
84
-
85
-
86
-
87
-
88
-
89
-
90
-
91
-
92
-
93
-
94
-
95
-
96
-
 97
97 -
 98
98 -
 99
99 -
 100
100 -
 101
101 -
 102
102 -
 103
103 -
 104
104 -
 105
105 -
 106
106 -
 107
107 -
 108
108 -
 109
109 -
 110
110 -
 111
111 -
 112
112 -
 113
113 -
 114
114 -
 115
115 -
 116
116 -
 117
117 -
118
-
119
-
120
-
121
-
122
-
123
-
124
-
125
-
126
-
127
-
128
-
129
-
130
-
131
-
132
-
133
-
134
-
135
-
136
-
137
-
138
-
139
-
140
-
141
-
142
-
143
-
144
-
145
-
146
-
147
-
148
-
149
-
150
-
151
-
152
-
153
-
154
-
155
-
156
 |
 |

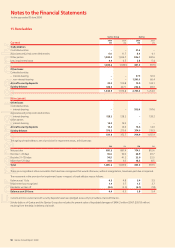
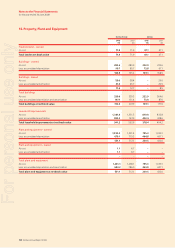
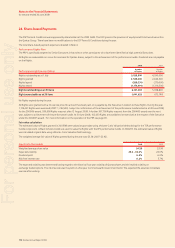
105 Qantas Annual Report 2008
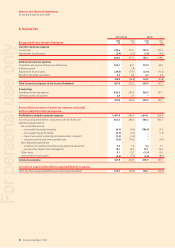
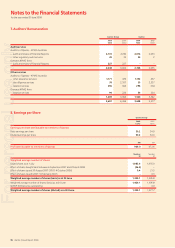
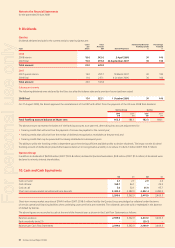
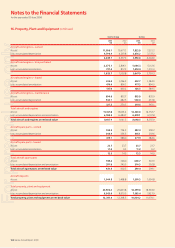
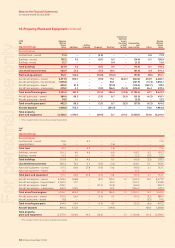
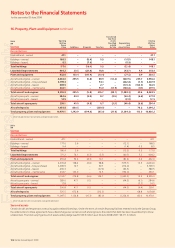
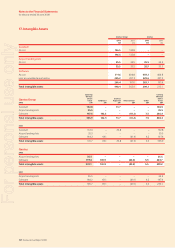
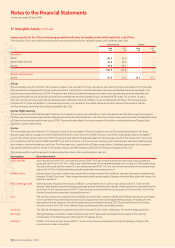
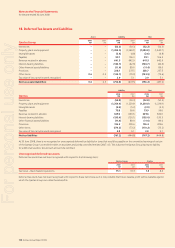
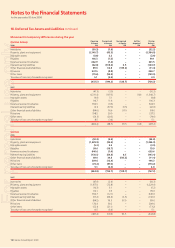
Notes to the Financial Statements
for the year ended 30 June 2008
2008
$M
Qantas Group
Opening
Written
Down
Value Additions
Entities
Acquired Disposals Transfers
Transferred
(to)/from
Assets
Classifi ed
as Held
for Sale
Depreciation
and
Amortisation Other1
Closing
Written
Down
Value
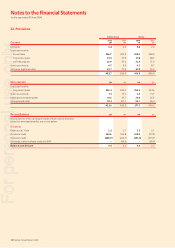
Reconciliations
Freehold land – owned 71.9 – – (2.0) – – – 2.0 71.9
Buildings – owned 195.2 0.2 – (0.7) 0.5 – (14.4) 0.1 180.9
Buildings – leased 12.7–––0.4–(1.5)–11.6
Total buildings 207.9 0.2 – (0.7) 0.9 – (15.9) 0.1 192.5
Leasehold improvements 563.6 25.2 – (5.3) 18.3 – (65.0) 4.4 541.2
Plant and equipment 512.1 166.4 – (10.6) (10.2) – (97.6) (9.0) 551.1
Aircraft and engines – owned 6,377.3 303.7 – (9.3) 75.1 (24.7) (647.3) 214.9 6,289.7
Aircraft and engines – hire purchased 1,993.8 – – – 93.1 – (221.9) (11.3) 1,853.7
Aircraft and engines – leased 400.2 51.5 – – (41.8) – (110.2) (162.7) 137.0
Aircraft and engines – maintenance 370.2 2.1 – (0.9) 156.0 (12.9) (213.2) 26.2 327.5
Total aircraft and engines 9,141.5 357.3 – (10.2) 282.4 (37.6) (1,192.6) 67.1 8,607.9
Aircraft spare parts – owned 388.0 88.5 – (1.1) 8.7 (3.5) (55.0) (6.5) 419.1
Aircraft spare parts – leased 14.5–––––(2.0)–12.5
Total aircraft spare parts 402.5 88.5 – (1.1) 8.7 (3.5) (57.0) (6.5) 431.6
Aircraft deposits 1,408.8 752.5 – – (291.4) – – 74.9 1,944.8
Total property,
plant and equipment 12,308.3 1,390.1 – (29.9) 8.7 (41.1) (1,428.1) 133.0 12,341.0
Other includes transfers to inventories and capitalised interest.
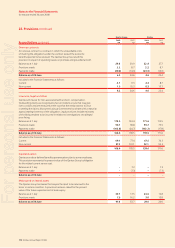
2007
$M
Qantas Group
Reconciliations
Freehold land – owned 65.6 – 6.3 – – – – – 71.9
Leasehold land 1.6 – – – (1.6) – – – –
Total land 67.2 – 6.3 – (1.6) – – – 71.9
Buildings – owned 201.3 4.0 4.6 – (0.2) – (14.7) 0.2 195.2
Buildings – leased 15.5 1.0 – – 0.9 – (2.2) (2.5) 12.7
Total buildings 216.8 5.0 4.6 – 0.7 – (16.9) (2.3) 207.9
Leasehold improvements 548.4 76.4 0.3 (0.3) (3.2) – (64.1) 6.1 563.6
Plant and equipment – owned 511.5 63.8 27.8 (9.5) 13.4 – (97.0) 2.1 512.1
Plant and equipment – leased 0.2 – – – – – (0.2) – –
Total plant and equipment 511.7 63.8 27.8 (9.5) 13.4 – (97.2) 2.1 512.1
Aircraft and engines – owned 6,793.0 146.8 – (8.7) 155.9 1.3 (724.2) 13.2 6,377.3
Aircraft and engines – hire purchased 2,052.0 12.7 – – 30.2 – (101.1) – 1,993.8
Aircraft and engines – leased 494.7 – – (12.3) (12.6) – (69.6) – 400.2
Aircraft and engines – maintenance 430.0 123.9 – – 12.5 – (196.2) – 370.2
Total aircraft and engines 9,769.7 283.4 – (21.0) 186.0 1.3 (1,091.1) 13.2 9,141.5
Aircraft spare parts – owned 376.6 65.4 – (3.6) 4.3 – (51.5) (3.2) 388.0
Aircraft spare parts – leased 17.8 – – – – – – (3.3) 14.5
Total aircraft spare parts 394.4 65.4 – (3.6) 4.3 – (51.5) (6.5) 402.5
Aircraft deposits 866.8 672.8 – – (199.6) – – 68.8 1,408.8
Total property,
plant and equipment 12,375.0 1,166.8 39.0 (34.4) – 1.3 (1,320.8) 81.4 12,308.3
Other includes transfers to inventories and capitalised interest.
1
1
16. Property, Plant and Equipment continued
For personal use only