Qantas 2008 Annual Report Download - page 114
Download and view the complete annual report
Please find page 114 of the 2008 Qantas annual report below. You can navigate through the pages in the report by either clicking on the pages listed below, or by using the keyword search tool below to find specific information within the annual report.-
 1
1 -
2
-
3
-
4
-
5
-
6
-
7
-
8
-
9
-
10
-
11
-
12
-
13
-
14
-
15
-
16
-
17
-
18
-
19
-
20
-
21
-
22
-
23
-
24
-
25
-
26
-
27
-
28
-
29
-
30
-
31
-
32
-
33
-
34
-
35
-
36
-
37
-
38
-
39
-
40
-
41
-
42
-
43
-
44
-
45
-
46
-
47
-
48
-
49
-
50
-
51
-
52
-
53
-
54
-
55
-
56
-
57
-
58
-
59
-
60
-
61
-
62
-
63
-
64
-
65
-
66
-
67
-
68
-
69
-
70
-
71
-
72
-
73
-
74
-
75
-
76
-
77
-
78
-
79
-
80
-
81
-
82
-
83
-
84
-
85
-
86
-
87
-
88
-
89
-
90
-
91
-
92
-
93
-
94
-
95
-
96
-
97
-
98
-
99
-
100
-
101
-
102
-
103
-
 104
104 -
 105
105 -
 106
106 -
 107
107 -
 108
108 -
 109
109 -
 110
110 -
 111
111 -
 112
112 -
 113
113 -
 114
114 -
 115
115 -
 116
116 -
 117
117 -
 118
118 -
 119
119 -
 120
120 -
 121
121 -
 122
122 -
 123
123 -
 124
124 -
125
-
126
-
127
-
128
-
129
-
130
-
131
-
132
-
133
-
134
-
135
-
136
-
137
-
138
-
139
-
140
-
141
-
142
-
143
-
144
-
145
-
146
-
147
-
148
-
149
-
150
-
151
-
152
-
153
-
154
-
155
-
156
 |
 |

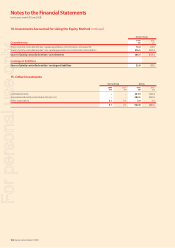
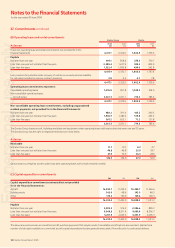
112 Qantas Annual Report 2008
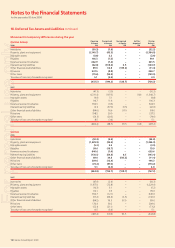
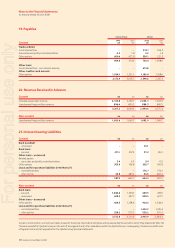
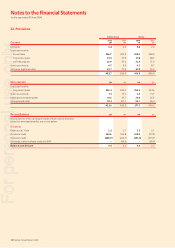
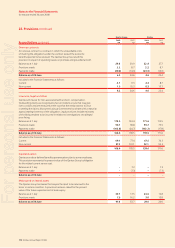
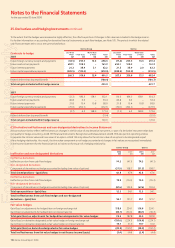
Notes to the Financial Statements
for the year ended 30 June 2008
Qantas Group Qantas
Current 2008
$M
2007
$M
2008
$M
2007
$M
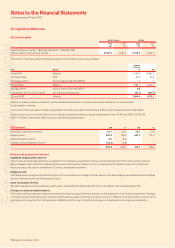
Dividends 4.8 2.2 4.8 2.2
Employee benefi ts
annual leave–346.7 322.9 289.6 268.9
long service leave–35.5 37.6 27.8 28.9
staff redundancy–22.9 51.0 22.9 51.0
Onerous contracts 4.7 9.3 4.3 8.7
Insurance, legal and other 69.1 77.4 67.5 76.3
483.7 500.4 416.9 436.0
Non-current $M $M $M $M
Employee benefi ts
long service leave–283.2 295.2 255.3 267.6
Onerous contracts 1.5 15.3 0.3 13.7
Make good on leased assets 41.6 33.7 29.6 26.6
Insurance and other 97.3 101.1 92.1 95.3
423.6 445.3 377.3 403.2
Reconciliations $M $M $M $M
Reconciliations of the carrying amounts of each class of provision,
except for employee benefi ts, are set out below:
Dividends
Balance as at 1 July 2.2 2.1 2.2 2.1
Provisions made 640.6 513.8 639.8 512.8
Payments made (638.0) (414.7) (637.2) (413.7)
Dividends settled in shares under the DRP –(99.0) –(99.0)
Balance as at 30 June 4.8 2.2 4.8 2.2
22. Provisions
For personal use only