Qantas 2008 Annual Report Download - page 148
Download and view the complete annual report
Please find page 148 of the 2008 Qantas annual report below. You can navigate through the pages in the report by either clicking on the pages listed below, or by using the keyword search tool below to find specific information within the annual report.-
 1
1 -
2
-
3
-
4
-
5
-
6
-
7
-
8
-
9
-
10
-
11
-
12
-
13
-
14
-
15
-
16
-
17
-
18
-
19
-
20
-
21
-
22
-
23
-
24
-
25
-
26
-
27
-
28
-
29
-
30
-
31
-
32
-
33
-
34
-
35
-
36
-
37
-
38
-
39
-
40
-
41
-
42
-
43
-
44
-
45
-
46
-
47
-
48
-
49
-
50
-
51
-
52
-
53
-
54
-
55
-
56
-
57
-
58
-
59
-
60
-
61
-
62
-
63
-
64
-
65
-
66
-
67
-
68
-
69
-
70
-
71
-
72
-
73
-
74
-
75
-
76
-
77
-
78
-
79
-
80
-
81
-
82
-
83
-
84
-
85
-
86
-
87
-
88
-
89
-
90
-
91
-
92
-
93
-
94
-
95
-
96
-
97
-
98
-
99
-
100
-
101
-
102
-
103
-
104
-
105
-
106
-
107
-
108
-
109
-
110
-
111
-
112
-
113
-
114
-
115
-
116
-
117
-
118
-
119
-
120
-
121
-
122
-
123
-
124
-
125
-
126
-
127
-
128
-
129
-
130
-
131
-
132
-
133
-
134
-
135
-
136
-
137
-
 138
138 -
 139
139 -
 140
140 -
 141
141 -
 142
142 -
 143
143 -
 144
144 -
 145
145 -
 146
146 -
 147
147 -
 148
148 -
 149
149 -
 150
150 -
 151
151 -
 152
152 -
 153
153 -
 154
154 -
 155
155 -
 156
156
 |
 |

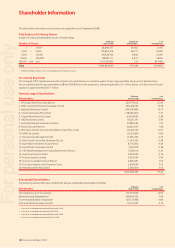
146 Qantas Annual Report 2008
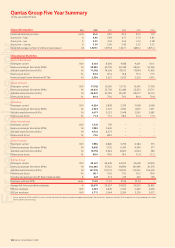
Qantas Group Five Year Summary
for the year ended 30 June
Share Information Unit 2008 2007 2006 2005 2004
Dividends declared per share cents 35.0 30.0 22.0 20.0 17.0
Share price – high $ 6.05 5.83 4.17 3.73 3.81
Share price – low $ 3.01 2.93 2.93 3.13 3.08
Share price – closing $ 3.04 5.60 2.96 3.37 3.52
Weighted average number of ordinary shares (basic) M 1,929.1 1,976.8 1,927.7 1,869.2 1,815.4
Operational Statistics
Qantas International1
Passengers carried 000 8,138 8,600 9,188 9,401 9,111
Revenue passenger kilometres (RPKs) M 59,030 60,709 59,948 58,631 55,395
Available seat kilometres (ASKs) M 71,563 74,596 78,012 77,834 71,455
Revenue seat factor % 82.5 81.4 76.8 75.3 77.5
Revenue freight tonne kilometres (RFTKs) M 2,596 2,621 2,633 2,329 1,601
Qantas Domestic
Passengers carried 000 17,105 16,350 15,772 16,145 17,700
Revenue passenger kilometres (RPKs) M 24,831 23,709 22,449 22,473 23,711
Available seat kilometres (ASKs) M 30,901 29,783 28,347 28,077 29,713
Revenue seat factor % 80.4 79.6 79.2 80.0 79.8
QantasLink
Passengers carried 000 4,204 3,858 3,316 3,058 2,996
Revenue passenger kilometres (RPKs) M 2,904 2,507 2,092 1,879 1,931
Available seat kilometres (ASKs) M 4,071 3,523 3,048 2,595 2,687
Revenue seat factor % 71.3 71.2 68.6 72.4 71.9
Jetstar International
Passengers carried 000 1,578 759 – – –
Revenue passenger kilometres (RPKs) M 7,099 2,945 – – –
Available seat kilometres (ASKs) M 9,731 4,273 – – –
Revenue seat factor % 73.0 68.9 – – –
Jetstar Domestic
Passengers carried 000 7,596 6,882 5,799 4,384 315
Revenue passenger kilometres (RPKs) M 8,602 7,752 6,410 4,3 46 277
Available seat kilometres (ASKs) M 10,753 9,944 8,663 6,004 383
Revenue seat factor % 80.0 78.0 74.0 72.4 72.3
Qantas Group1
Passengers carried 000 38,621 36,449 34,075 32,658 30,076
Revenue passenger kilometres (RPKs) M 102,466 97,622 90,899 86,986 81,276
Available seat kilometres (ASKs) M 127,019 122,119 118 ,070 114,0 03 10 4,20 0
Revenue seat factor % 80.7 79.9 77.0 76.3 78.0
Operational passenger aircraft fl eet at balance date # 224 213 216 200 190
Passenger yield (per RPK) cents 11.81 11.67 10.9 4 10.3 4 –
Average full-time equivalent employees # 33,670 34,267 34,832 35,520 33,862
RPK per employee 000 3,043 2,849 2,610 2,449 2,400
ASK per employee 000 3,772 3,564 3,390 3,210 3,077
Qantas and Jetstar 2005 and 2004 statistics include the effect of a domestic codeshare agreement between the two airlines. However, the effec t of this codeshare is only included once in these
statistics for the Qantas Group.
1
For personal use only