Qantas 2008 Annual Report Download - page 126
Download and view the complete annual report
Please find page 126 of the 2008 Qantas annual report below. You can navigate through the pages in the report by either clicking on the pages listed below, or by using the keyword search tool below to find specific information within the annual report.-
 1
1 -
2
-
3
-
4
-
5
-
6
-
7
-
8
-
9
-
10
-
11
-
12
-
13
-
14
-
15
-
16
-
17
-
18
-
19
-
20
-
21
-
22
-
23
-
24
-
25
-
26
-
27
-
28
-
29
-
30
-
31
-
32
-
33
-
34
-
35
-
36
-
37
-
38
-
39
-
40
-
41
-
42
-
43
-
44
-
45
-
46
-
47
-
48
-
49
-
50
-
51
-
52
-
53
-
54
-
55
-
56
-
57
-
58
-
59
-
60
-
61
-
62
-
63
-
64
-
65
-
66
-
67
-
68
-
69
-
70
-
71
-
72
-
73
-
74
-
75
-
76
-
77
-
78
-
79
-
80
-
81
-
82
-
83
-
84
-
85
-
86
-
87
-
88
-
89
-
90
-
91
-
92
-
93
-
94
-
95
-
96
-
97
-
98
-
99
-
100
-
101
-
102
-
103
-
104
-
105
-
106
-
107
-
108
-
109
-
110
-
111
-
112
-
113
-
114
-
115
-
 116
116 -
 117
117 -
 118
118 -
 119
119 -
 120
120 -
 121
121 -
 122
122 -
 123
123 -
 124
124 -
 125
125 -
 126
126 -
 127
127 -
 128
128 -
 129
129 -
 130
130 -
 131
131 -
 132
132 -
 133
133 -
 134
134 -
 135
135 -
 136
136 -
137
-
138
-
139
-
140
-
141
-
142
-
143
-
144
-
145
-
146
-
147
-
148
-
149
-
150
-
151
-
152
-
153
-
154
-
155
-
156
 |
 |

124 Qantas Annual Report 2008
Notes to the Financial Statements
for the year ended 30 June 2008
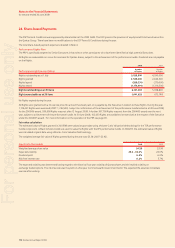
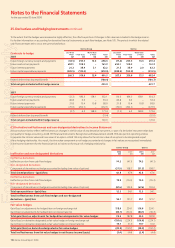
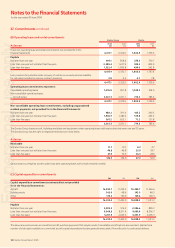
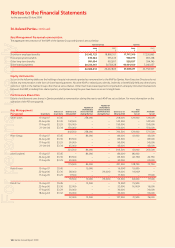
The Qantas Superannuation Plan (QSP) is a hybrid defi ned benefi t/defi ned contribution fund with 13 separate divisions which commenced operation
in June 1939. In addition to the QSP, there are a number of small offshore defi ned benefi t plans.
The Qantas Group makes contributions to defi ned benefi t superannuation plans that provide defi ned benefi t amounts for employees upon
retirement. Under the plans, employees are entitled to retirement benefi ts determined, at least in part, by reference to a formula based on
years of membership and salary levels. The total plan assets include fi nancial instruments issued by Qantas with a fair value of $18.1 million
(2007: $5.9 million). Plan assets also include an investment in a trust which owns a 50 per cent interest in property occupied by the Qantas Group.
The value of this investment is $17.4 million (2007: $17.4 million).
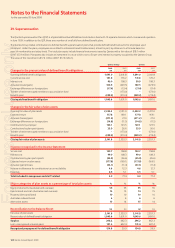
Qantas Group Qantas
Changes in the present value of defined benefit obligations 2008
$M
2007
$M
2008
$M
2007
$M
Opening defi ned benefi t obligations 1,691.0 2,041.8 1,691.0 2,041.8
Current service cost 141.8 176.2 141.8 176.2
Interest cost 99.0 108.3 99.0 108.3
Actuarial losses/(gains) 180.5 (229.5) 180.5 (229.5)
Exchange differences on foreign plans (17.4) (13.4) (17.4) (13.4)
Transfer of retirement aged members to accumulation fund –(173.0) –(173.0)
Benefi ts paid (249.3) (219.4) (249.3) (219.4)
Closing defined benefit obligation 1,845.6 1,691.0 1,845.6 1,691.0
Changes in the fair value of plan assets
Opening fair value of plan assets 2,353.3 2,411.0 2,353.3 2,411.0
Expected return 177.8 169.1 177.8 169.1
Actuarial (losses)/gains (271.2) 27.0 (271.2) 27.0
Exchange differences on foreign plans (14.8) (11.5) (14.8) (11.5)
Contributions by employer 120.1 123.5 120.1 123.5
Contributions by plan participants 25.9 26.6 25.9 26.6
Transfer of retirement aged members to accumulation fund –(173.0) –(173.0)
Benefi ts paid (249.3) (219.4) (249.3) (219.4)
Closing fair value of plan assets 2,141.8 2,353.3 2,141.8 2,353.3
Expense recognised in the Income Statement
Service cost 130.7 158.8 130.7 158.8
Interest cost 99.0 108.3 99.0 108.3
Contributions by plan participants (25.9) (26.6) (25.9) (26.6)
Expected return on plan assets (177.8) (169.1) (177.8) (169.1)
Actuarial (gains)/losses (33.1) (11.4) (33.1) (11.4)
Increase in allowance for contributions tax on net liability 4.6 12.3 4.6 12.3
Expenses 6.5 5.1 6.5 5.1
Total included in manpower and staff related 4.0 77.4 4.0 77.4
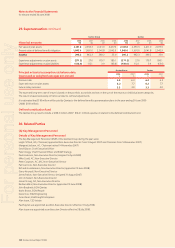
Major categories of plan assets as a percentage of total plan assets %%%%
Equity instruments (Australian and overseas) 55 55 55 55
Fixed interest and cash (Australian and overseas) 14 15 14 15
Property (direct and listed) 10 10 10 10
Australian indexed bonds 6666
Alternative assets 15 14 15 14
Reconciliation to the Balance Sheet $M $M $M $M
Fair value of plan assets 2,141.8 2,353.3 2,141.8 2,353.3
Present value of defi ned benefi t obligation 1,845.6 1,691.0 1,845.6 1,691.0
Surplus 296.2 662.3 296.2 662.3
Less: unrecognised actuarial gains 141.4 622.4 141.4 622.4
Recognised prepayment for defined benefit obligation 154.8 39.9 154.8 39.9
29. Superannuation
For personal use only