Qantas 2008 Annual Report Download - page 101
Download and view the complete annual report
Please find page 101 of the 2008 Qantas annual report below. You can navigate through the pages in the report by either clicking on the pages listed below, or by using the keyword search tool below to find specific information within the annual report.-
 1
1 -
2
-
3
-
4
-
5
-
6
-
7
-
8
-
9
-
10
-
11
-
12
-
13
-
14
-
15
-
16
-
17
-
18
-
19
-
20
-
21
-
22
-
23
-
24
-
25
-
26
-
27
-
28
-
29
-
30
-
31
-
32
-
33
-
34
-
35
-
36
-
37
-
38
-
39
-
40
-
41
-
42
-
43
-
44
-
45
-
46
-
47
-
48
-
49
-
50
-
51
-
52
-
53
-
54
-
55
-
56
-
57
-
58
-
59
-
60
-
61
-
62
-
63
-
64
-
65
-
66
-
67
-
68
-
69
-
70
-
71
-
72
-
73
-
74
-
75
-
76
-
77
-
78
-
79
-
80
-
81
-
82
-
83
-
84
-
85
-
86
-
87
-
88
-
89
-
90
-
 91
91 -
 92
92 -
 93
93 -
 94
94 -
 95
95 -
 96
96 -
 97
97 -
 98
98 -
 99
99 -
 100
100 -
 101
101 -
 102
102 -
 103
103 -
 104
104 -
 105
105 -
 106
106 -
 107
107 -
 108
108 -
 109
109 -
 110
110 -
 111
111 -
112
-
113
-
114
-
115
-
116
-
117
-
118
-
119
-
120
-
121
-
122
-
123
-
124
-
125
-
126
-
127
-
128
-
129
-
130
-
131
-
132
-
133
-
134
-
135
-
136
-
137
-
138
-
139
-
140
-
141
-
142
-
143
-
144
-
145
-
146
-
147
-
148
-
149
-
150
-
151
-
152
-
153
-
154
-
155
-
156
 |
 |

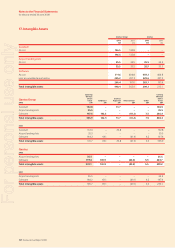
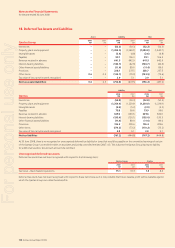
99 Qantas Annual Report 2008
Notes to the Financial Statements
for the year ended 30 June 2008
Qantas Group Qantas
2008
$M
2007
$M
2008
$M
2007
$M
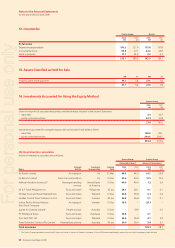
At fair value
Engineering expendables 150.2 121.0 115.8 87.8
Consumable stores 53.8 37. 144.0 29.6
Work in progress 11.7 22.2 3.2 6.7
215.7 180.3 163.0 124.1
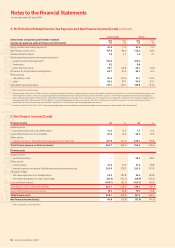
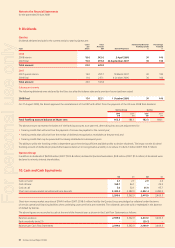
13. Assets Classified as Held for Sale
$M $M $M $M
Property, plant and equipment 41.1 5.4 27.6 1.8
41.1 5.4 27.6 1.8
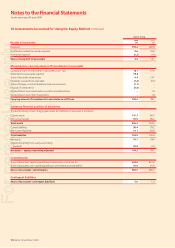
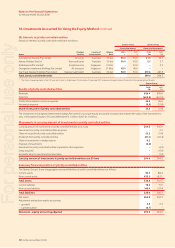
14. Investments Accounted for Using the Equity Method
Qantas Group
2008
$M
2007
$M
Share of net profi t of associates and jointly controlled entities included in the Income Statement:
associates–4.4 14.7
jointly controlled entities– 23.2 31.8
27.6 46.5
Investments accounted for using the equity method included in the Balance Sheet:
associates–109.2 78.1
jointly controlled entities– 294.6 294.5
403.8 372.6
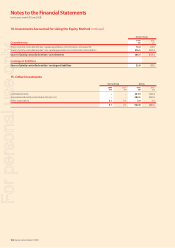
(A) Investments in associates
Details of interests in associates are as follows:
Qantas Group Qantas Group
Ownership Interest Amount of Investment
Name
Principal
Activity
Country of
Incorporation
Balance
Date
2008
%
2007
%
2008
$M
2007
$M
Air Pacifi c Limited Air transport Fiji 31 Mar 46.3 46.3 61.1 55.4
Fiji Resorts Limited Resort accommodation Fiji 31 Dec 20.6 20.6 12.5 12.3
Hallmark Aviation Services LP Passenger handling
services
United States
of America
31 Dec 49.0 49.0 1.2 2.4
HT & T Travel Philippines Inc. Tours and travel Philippines 30 Jun 28.1 28.1 0.1 0.1
Holiday Tours and Travel (Thailand) Ltd. Tours and travel Thailand 31 Dec 36.8 36.8 0.3 0.4
Holiday Tours & Travel Vietnam Co. Ltd. Tours and travel Vietnam 30 Jun 36.8 36.8 0.1 0.1
Jetstar Pacifi c Airlines Aviation
Joint Stock Company
Air transport Vietnam 31 Dec 18.0 –29.3 –
Jupiter Air Oceania Limited1Freight services Australia 31 Dec –47.6 –0.3
PT Holidays & Travel Tours and travel Indonesia 31 Dec 36.8 –0.1 –
Tour East (TET) Ltd. Tours and travel Thailand 31 Dec 36.8 36.8 2.1 2.0
Travel Software Solutions Pty Limited Reservations systems Australia 30 Jun 50.0 50.0 2.4 5.1
Total associates 109.2 78.1
The Qantas Group acquired the remaining 52.4 per cent interest in Jupiter Air Oceania Limited on 18 June 2008 and ceased to equity account the results of the company from this date.
1
12. Inventories
For personal use only