Qantas 2008 Annual Report Download - page 94
Download and view the complete annual report
Please find page 94 of the 2008 Qantas annual report below. You can navigate through the pages in the report by either clicking on the pages listed below, or by using the keyword search tool below to find specific information within the annual report.-
 1
1 -
2
-
3
-
4
-
5
-
6
-
7
-
8
-
9
-
10
-
11
-
12
-
13
-
14
-
15
-
16
-
17
-
18
-
19
-
20
-
21
-
22
-
23
-
24
-
25
-
26
-
27
-
28
-
29
-
30
-
31
-
32
-
33
-
34
-
35
-
36
-
37
-
38
-
39
-
40
-
41
-
42
-
43
-
44
-
45
-
46
-
47
-
48
-
49
-
50
-
51
-
52
-
53
-
54
-
55
-
56
-
57
-
58
-
59
-
60
-
61
-
62
-
63
-
64
-
65
-
66
-
67
-
68
-
69
-
70
-
71
-
72
-
73
-
74
-
75
-
76
-
77
-
78
-
79
-
80
-
81
-
82
-
83
-
 84
84 -
 85
85 -
 86
86 -
 87
87 -
 88
88 -
 89
89 -
 90
90 -
 91
91 -
 92
92 -
 93
93 -
 94
94 -
 95
95 -
 96
96 -
 97
97 -
 98
98 -
 99
99 -
 100
100 -
 101
101 -
 102
102 -
 103
103 -
 104
104 -
105
-
106
-
107
-
108
-
109
-
110
-
111
-
112
-
113
-
114
-
115
-
116
-
117
-
118
-
119
-
120
-
121
-
122
-
123
-
124
-
125
-
126
-
127
-
128
-
129
-
130
-
131
-
132
-
133
-
134
-
135
-
136
-
137
-
138
-
139
-
140
-
141
-
142
-
143
-
144
-
145
-
146
-
147
-
148
-
149
-
150
-
151
-
152
-
153
-
154
-
155
-
156
 |
 |

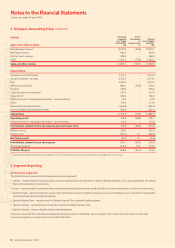
92 Qantas Annual Report 2008
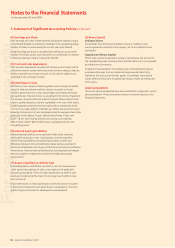
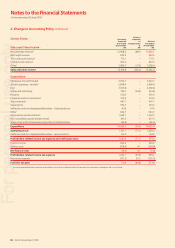
Notes to the Financial Statements
for the year ended 30 June 2008
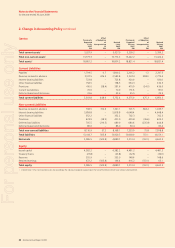
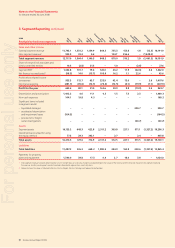
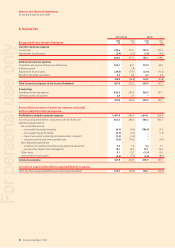
3. Segment Reporting continued
2007
Analysis by business segments
Sales and other income
External segment revenue 11,158.0 1,061.1 1,065.7 835.8 767.5 158.0 2.3 12.0 15,060.4
Inter-segment revenue1803.3 68.3 0.7 – 161.0 360.7 – (1,394.0) –
Total segment revenue 11,961.3 1,129.4 1,066.4 835.8 928.5 518.7 2.3 (1,382.0) 15,060.4
Share of net profi t of associates and
jointly controlled entities 14.3 (0.3) 32.7 – 0.8 – (1.0) – 46.5
Segment EBIT 886.2 71.3 84.7 127.7 30.5 18.5 (246.6) 3.6 975.9
Net fi nance income/(costs)2(117.1) 10.6 (19.8) 82.9 15.5 0.6 16.5 – (10.8)
Profi t before related income
tax expense 769.1 81.9 64.9 210.6 46.0 19.1 (230.1) 3.6 965.1
Income tax expense (227.5) (26.1) (9.7) (63.3) (13.6) (5.6) 54.6 (1.1) (292.3)
Profit for the year 541.6 55.8 55.2 147.3 32.4 13.5 (175.5) 2.5 672.8
Depreciation and amortisation 1,332.9 8.4 12.3 – 1.4 7.7 – – 1,362.7
Non-cash expenses 97.34.6–––– ––101.9
Signifi cant items included
in segment results:
liquidated damages–––––––97.7–97.7
gain on sale of investments–––––––30.6–30.6
accelerated depreciation
and impairment losses
–
(44.8)–––––– –(44.8)
provisions for freight
cartel investigations
–
––––––(47.2)–(47.2)
Assets
Segment assets 16,590.1 479.0 385.2 2,108.1 435.0 326.3 246.2 (1,448.8) 19,121.1
Investments accounted for using
the equity method 72.8 – 292.1 – 2.6 – 5.1 – 372.6
Total assets 16,662.9 479.0 677.3 2,108.1 437.6 326.3 251.3 (1,448.8) 19,493.7
Liabilities
Total liabilities 11,518.9 318.5 712.1 1,960.2 253.3 190.5 349.2 (1,448.8) 13,853.9
Payments for property,
plant and equipment 1,241.1 20.0 10.7 – 3.6 6.7 – – 1,282.1
Inter-segment revenue has been determined on an arm’s length basis or a cost plus margin basis depending on the nature of the revenue and the fi nancial impact on the segment receiving
the revenue. Ancillary and support services have been allocated to segments on a cost only basis.
Notional interest has been attributed to Qantas, Qantas Freight, Qantas Catering and Corporate/Unallocated.
1
2
Qantas
$M
Jetstar
$M
Qantas
Frequent Flyer
$M
Qantas
Holidays
$M
Qantas
Catering
$M
Corporate/
Unallocated
$M
Consolidated
$M
Eliminations
$M
Qantas
Freight
$M
For personal use only