Qantas 2008 Annual Report Download - page 149
Download and view the complete annual report
Please find page 149 of the 2008 Qantas annual report below. You can navigate through the pages in the report by either clicking on the pages listed below, or by using the keyword search tool below to find specific information within the annual report.-
 1
1 -
2
-
3
-
4
-
5
-
6
-
7
-
8
-
9
-
10
-
11
-
12
-
13
-
14
-
15
-
16
-
17
-
18
-
19
-
20
-
21
-
22
-
23
-
24
-
25
-
26
-
27
-
28
-
29
-
30
-
31
-
32
-
33
-
34
-
35
-
36
-
37
-
38
-
39
-
40
-
41
-
42
-
43
-
44
-
45
-
46
-
47
-
48
-
49
-
50
-
51
-
52
-
53
-
54
-
55
-
56
-
57
-
58
-
59
-
60
-
61
-
62
-
63
-
64
-
65
-
66
-
67
-
68
-
69
-
70
-
71
-
72
-
73
-
74
-
75
-
76
-
77
-
78
-
79
-
80
-
81
-
82
-
83
-
84
-
85
-
86
-
87
-
88
-
89
-
90
-
91
-
92
-
93
-
94
-
95
-
96
-
97
-
98
-
99
-
100
-
101
-
102
-
103
-
104
-
105
-
106
-
107
-
108
-
109
-
110
-
111
-
112
-
113
-
114
-
115
-
116
-
117
-
118
-
119
-
120
-
121
-
122
-
123
-
124
-
125
-
126
-
127
-
128
-
129
-
130
-
131
-
132
-
133
-
134
-
135
-
136
-
137
-
138
-
 139
139 -
 140
140 -
 141
141 -
 142
142 -
 143
143 -
 144
144 -
 145
145 -
 146
146 -
 147
147 -
 148
148 -
 149
149 -
 150
150 -
 151
151 -
 152
152 -
 153
153 -
 154
154 -
 155
155 -
 156
156
 |
 |

147 Qantas Annual Report 2008
Sustainability Statistics and Policies
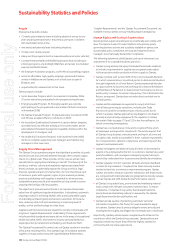
Report Scope
Qantas produced its fi rst sustainability report in 2007, providing information on the Qantas impact on the economy and the environment;
its people and the community; employee and customer safety; operational security; and human rights. In 2008, the discussion on people has been
expanded and the Qantas Foundation introduced.
The sustainability information and performance data in this report applies to all wholly owned operations of the Qantas Group globally unless
otherwise indicated.
The selection of content and key performance measures is made on the basis of materiality, stakeholder interest and guidance provided by the
leading sustainability framework the Global Reporting Initiative (GRI), G3 Sustainability Reporting Guidelines (www.globalreporting.org). The GRI
provides a generally accepted framework for sustainability reporting that can be used by organisations of any size, sector or location. The metrics
align with Qantas’ overall business strategy.
The data is provided for the information of a wide range of stakeholders including customers, shareholders, employees, suppliers, regulators,
politicians, non-government organisations, fi nanciers and various special interest groups. Qantas undertakes extensive research on customer
attitudes, has mature stakeholder feedback processes in place, and uses a risk management system to capture feedback from various internal
and external sources.
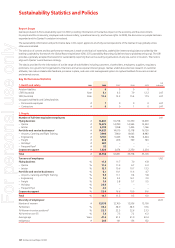
Key Performance Statistics
1. Health and safety Unit 2008 2007 2006 2005
GRI
Indicator1
Aviation fatalities # 0000
LTIFR (Australia) Rate 5.1 6.3 7.9 12.2 LA7
SIFR (Australia) Rate 13.2 12.3 15.4 17.5 LA7
Occupational Health and Safety fatalities
Permanent employees–#1000LA7
Contractors–#0010LA7
2. People
Number of full-time equivalent employees LA1
Flying business #16,807 16,738 16,350 16,699
Qantas–#14,072 14,780 14,945 15,533
Jetstar–#2,735 1,958 1,405 1,166
Portfolio and service businesses2#14,927 14,019 15,178 16,150
Airports, Catering and Flight Training–#7,998 7,800 8,645 8,983
Engineering–#5,551 5,403 5,764 6,424
Freight–#838 816 769 743
Holidays3
–#487 –––
Frequent Flyer4
–#53 –––
Corporate support #1,824 2,074 2,250 2,254
Total #33,558 32,831 33,778 35,103
Turnover of employees LA2
Flying business %11.8 11.7 7.0 6 .8
Qantas–%11.6 11.9 6 .7 6.3
Jetstar–%12.7 10.6 10.7 13.3
Portfolio and service businesses %8.1 10.1 11.6 4.7
Airports, Catering and Flight Training–%9.5 11.1 9.4 5.8
Engineering–%7. 2 9.2 16.1 2.9
Freight–%7.4 5.8 5.7 5.5
Holidays–%23.6 –––
Frequent Flyer–%2.0 –––
Corporate support %22.6 16.6 10.9 8.6
Total %10.7 11.3 9.3 6.0
Diversity of employees5LA13
Number of women # 13,158 12,760 12,936 13,190
% Women % 39.2 38.9 38.3 37.6
% Women in senior positions6%22.7 22.5 22.6 23.3
% Part-time over 55 % 7.8 7.5 7.2 6. 3
Average age Years 41.2 41.2 41.0 40.4
Indigenous # 203 141 136 132
For personal use only