Qantas 2008 Annual Report Download - page 76
Download and view the complete annual report
Please find page 76 of the 2008 Qantas annual report below. You can navigate through the pages in the report by either clicking on the pages listed below, or by using the keyword search tool below to find specific information within the annual report.-
 1
1 -
2
-
3
-
4
-
5
-
6
-
7
-
8
-
9
-
10
-
11
-
12
-
13
-
14
-
15
-
16
-
17
-
18
-
19
-
20
-
21
-
22
-
23
-
24
-
25
-
26
-
27
-
28
-
29
-
30
-
31
-
32
-
33
-
34
-
35
-
36
-
37
-
38
-
39
-
40
-
41
-
42
-
43
-
44
-
45
-
46
-
47
-
48
-
49
-
50
-
51
-
52
-
53
-
54
-
55
-
56
-
57
-
58
-
59
-
60
-
61
-
62
-
63
-
64
-
65
-
 66
66 -
 67
67 -
 68
68 -
 69
69 -
 70
70 -
 71
71 -
 72
72 -
 73
73 -
 74
74 -
 75
75 -
 76
76 -
 77
77 -
 78
78 -
 79
79 -
 80
80 -
 81
81 -
 82
82 -
 83
83 -
 84
84 -
 85
85 -
 86
86 -
87
-
88
-
89
-
90
-
91
-
92
-
93
-
94
-
95
-
96
-
97
-
98
-
99
-
100
-
101
-
102
-
103
-
104
-
105
-
106
-
107
-
108
-
109
-
110
-
111
-
112
-
113
-
114
-
115
-
116
-
117
-
118
-
119
-
120
-
121
-
122
-
123
-
124
-
125
-
126
-
127
-
128
-
129
-
130
-
131
-
132
-
133
-
134
-
135
-
136
-
137
-
138
-
139
-
140
-
141
-
142
-
143
-
144
-
145
-
146
-
147
-
148
-
149
-
150
-
151
-
152
-
153
-
154
-
155
-
156
 |
 |

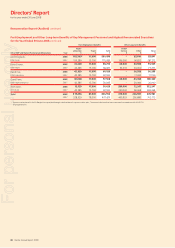
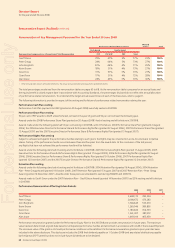
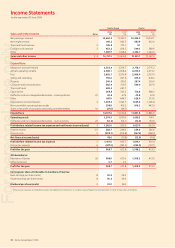
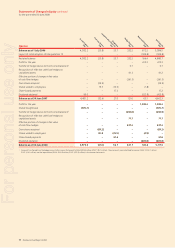
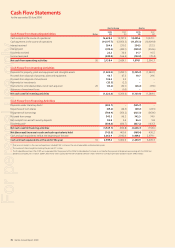
74 Qantas Annual Report 2008
Qantas Group Qantas
Sales and Other Income Notes
2008
$M
20071
$M
2008
$M
20071
$M
Net passenger revenue 12,664.4 11,920.1 10,335.9 10,092.1
Net freight revenue 947.3 902.5 687.9 902.0
Tours and travel revenue 3 745.8 775.1 5.1 –
Contract work revenue 3 453.5 434.3 309.5 348.6
Other 1,380.9 1,028.4 2,102.7 1,244.3
Sales and other income 3, 4 16,191.9 15,060.4 13,441.1 12,587.0
Expenditure
Manpower and staff related 3,533.4 3,334.7 2,778.7 2,715.2
Aircraft operating variable 2,588.1 2,608.4 2,240.3 2,373.2
Fuel 3,602.1 3,336.8 2,988.0 2,927.0
Selling and marketing 755.6 691.8 675.0 649.2
Property 346.4 350.5 287.4 309.0
Computer and communication 382.4 319.5 309.0 267.9
Tours and travel 608.4 641.7 ––
Capacity hire 269.8 303.2 176.8 348.2
Ineffective and non-designated derivatives – closed positions 25 42.8 67.6 42.8 67.6
Other 847.0 644.7 628.0 513.9
Depreciation and amortisation 3 1,469.3 1,362.7 1,309.6 1,266.8
Non-cancellable operating lease rentals 399.9 415.3 366.2 442.9
Share of net profi t of associates and jointly controlled entities 14 (27.6) (46.5) ––
Expenditure 14,817.6 14,030.4 11,801.8 11, 880.9
Operating result 1,374.3 1,030.0 1,639.3 706.1
Ineffective and non-designated derivatives – open positions 25 (12.3) (54.1) (12.3) (54.1)
Profit before related income tax expense and net finance income/(costs) 31,362.0 975.9 1,627.0 652.0
Finance income 3,5 284.7 244.0 254.6 226.6
Finance costs 5 (239.1) (254.8) (267.5) (268.2)
Net finance income/(costs) 45.6 (10.8) (12.9) (41.6)
Profit before related income tax expense 31,407.6 965.1 1,614.1 610.4
Income tax expense 6 (437.9) (292.3) (305.9) (197.1)
Profit for the year 3969.7 672.8 1,308.2 413.3
Attributable to:
Members of Qantas 26 969.0 672.6 1,308.2 413.3
Minority interest 0.7 0.2 ––
Profit for the year 969.7 672.8 1,308.2 413.3
Earnings per share attributable to members of Qantas:
Basic earnings per share (cents) 8 50.2 34.0
Diluted earnings per share (cents) 8 50.2 34.0
Dividend per share (cents) 933.0 26.0
Comparatives have been restated following the early adoption of Interpretation 13 Customer Loyalty Programmes (Interpretation 13). Refer to Note 2 for further details.
1
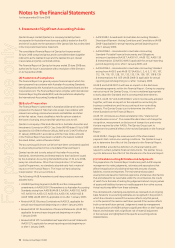
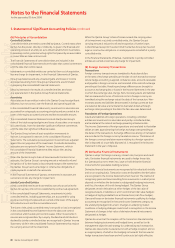
Income Statements
for the year ended 30 June 2008
For personal use only