Qantas 2008 Annual Report Download - page 113
Download and view the complete annual report
Please find page 113 of the 2008 Qantas annual report below. You can navigate through the pages in the report by either clicking on the pages listed below, or by using the keyword search tool below to find specific information within the annual report.-
 1
1 -
2
-
3
-
4
-
5
-
6
-
7
-
8
-
9
-
10
-
11
-
12
-
13
-
14
-
15
-
16
-
17
-
18
-
19
-
20
-
21
-
22
-
23
-
24
-
25
-
26
-
27
-
28
-
29
-
30
-
31
-
32
-
33
-
34
-
35
-
36
-
37
-
38
-
39
-
40
-
41
-
42
-
43
-
44
-
45
-
46
-
47
-
48
-
49
-
50
-
51
-
52
-
53
-
54
-
55
-
56
-
57
-
58
-
59
-
60
-
61
-
62
-
63
-
64
-
65
-
66
-
67
-
68
-
69
-
70
-
71
-
72
-
73
-
74
-
75
-
76
-
77
-
78
-
79
-
80
-
81
-
82
-
83
-
84
-
85
-
86
-
87
-
88
-
89
-
90
-
91
-
92
-
93
-
94
-
95
-
96
-
97
-
98
-
99
-
100
-
101
-
102
-
 103
103 -
 104
104 -
 105
105 -
 106
106 -
 107
107 -
 108
108 -
 109
109 -
 110
110 -
 111
111 -
 112
112 -
 113
113 -
 114
114 -
 115
115 -
 116
116 -
 117
117 -
 118
118 -
 119
119 -
 120
120 -
 121
121 -
 122
122 -
 123
123 -
124
-
125
-
126
-
127
-
128
-
129
-
130
-
131
-
132
-
133
-
134
-
135
-
136
-
137
-
138
-
139
-
140
-
141
-
142
-
143
-
144
-
145
-
146
-
147
-
148
-
149
-
150
-
151
-
152
-
153
-
154
-
155
-
156
 |
 |

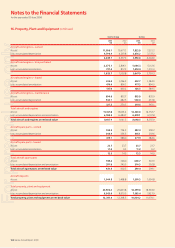
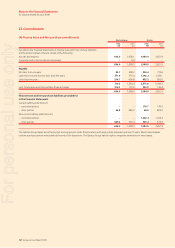
111 Qantas Annual Report 2008
Notes to the Financial Statements
for the year ended 30 June 2008
Qantas Group Qantas
Current 2008
$M
2007
$M
2008
$M
2007
$M
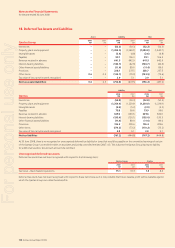
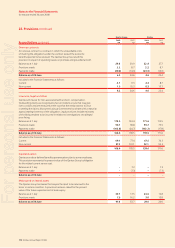
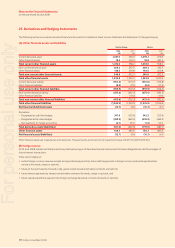
Trade creditors
Controlled entities ––214.1 576.2
Associates and jointly controlled entities 0.2 1.8 0.2 1.4
Other parties 669.6 672.8 524.1 521.3
669.8 674.6 738.4 1,098.9
Other loans
Controlled entities – non-interest-bearing ––674.8 –
Other creditors and accruals
Other parties 1,504.1 1,331.1 1,185.4 1,108.6
2,173.9 2,005.7 2,598.6 2,207.5
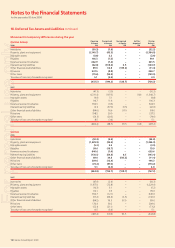
20. Revenue Received in Advance
Current $M $M $M $M
Unavailed passenger revenue 2,370.8 2,199.1 2,006.3 1,932.9
Unredeemed frequent fl yer revenue 896.4 850.2 888.3 842.5
3,267.2 3,049.3 2,894.6 2,775.4
Non-current $M $M $M $M
Unredeemed frequent fl yer revenue 1,082.6 1,049.7 1,082.6 1,049.7
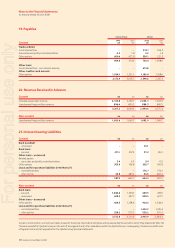
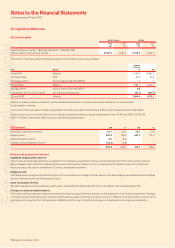
21. Interest-bearing Liabilities
Current $M $M $M $M
Bank overdraft
unsecured–––20.1 –
Bank loans
secured–211.1 207.2 91.3 89.5
Other loans – unsecured
Related parties
associates and jointly controlled entities–3.4 6.5 3.4 6.5
Other parties 305.9 166.8 305.7 166.8
Lease and hire purchase liabilities (refer Note 27)
controlled entities–––176.7 174.0
other parties–66.8 483.2 66.8 483.2
587.2 863.7 664.0 920.0
Non-current $M $M $M $M
Bank loans
secured–1,480.6 1,769.3 669.5 787.6
unsecured–628.5 627.7 628.5 627.7
Other loans – unsecured
Other parties 924.5 1,238.6 924.5 1,238.4
Lease and hire purchase liabilities (refer Note 27)
controlled entities–––1,202.2 1,419.4
other parties–539.2 575.3 539.2 575.3
3,572.8 4,210.9 3,963.9 4,648.4
Certain current and non-current loans relate to specifi c fi nancings of aircraft and engines and are secured by the aircraft to which they relate (refer Note 16).
The bank overdraft in Qantas forms part of a set-off arrangement with other subsidaries within the Qantas Group. Consequently, this bank overdraft is set
off against cash and cash equivalents in the Qantas Group fi nancial statements.
19. Payables
For personal use only