Qantas 2008 Annual Report Download - page 105
Download and view the complete annual report
Please find page 105 of the 2008 Qantas annual report below. You can navigate through the pages in the report by either clicking on the pages listed below, or by using the keyword search tool below to find specific information within the annual report.-
 1
1 -
2
-
3
-
4
-
5
-
6
-
7
-
8
-
9
-
10
-
11
-
12
-
13
-
14
-
15
-
16
-
17
-
18
-
19
-
20
-
21
-
22
-
23
-
24
-
25
-
26
-
27
-
28
-
29
-
30
-
31
-
32
-
33
-
34
-
35
-
36
-
37
-
38
-
39
-
40
-
41
-
42
-
43
-
44
-
45
-
46
-
47
-
48
-
49
-
50
-
51
-
52
-
53
-
54
-
55
-
56
-
57
-
58
-
59
-
60
-
61
-
62
-
63
-
64
-
65
-
66
-
67
-
68
-
69
-
70
-
71
-
72
-
73
-
74
-
75
-
76
-
77
-
78
-
79
-
80
-
81
-
82
-
83
-
84
-
85
-
86
-
87
-
88
-
89
-
90
-
91
-
92
-
93
-
94
-
 95
95 -
 96
96 -
 97
97 -
 98
98 -
 99
99 -
 100
100 -
 101
101 -
 102
102 -
 103
103 -
 104
104 -
 105
105 -
 106
106 -
 107
107 -
 108
108 -
 109
109 -
 110
110 -
 111
111 -
 112
112 -
 113
113 -
 114
114 -
 115
115 -
116
-
117
-
118
-
119
-
120
-
121
-
122
-
123
-
124
-
125
-
126
-
127
-
128
-
129
-
130
-
131
-
132
-
133
-
134
-
135
-
136
-
137
-
138
-
139
-
140
-
141
-
142
-
143
-
144
-
145
-
146
-
147
-
148
-
149
-
150
-
151
-
152
-
153
-
154
-
155
-
156
 |
 |

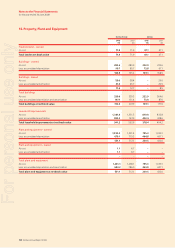
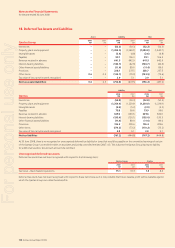
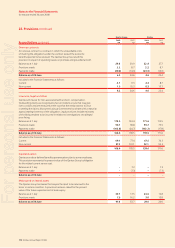
103 Qantas Annual Report 2008
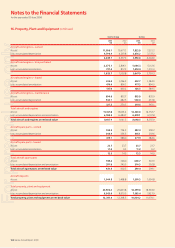
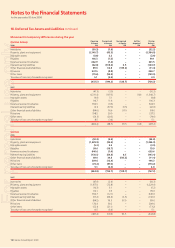
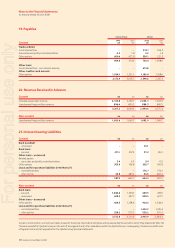
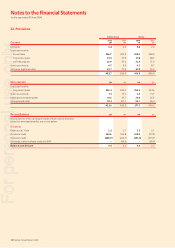
Notes to the Financial Statements
for the year ended 30 June 2008
Qantas Group Qantas
2008
$M
2007
$M
2008
$M
2007
$M
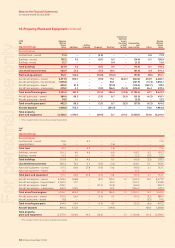
Freehold land – owned
At cost 71.9 71.9 47.1 47.1
Total land at net book value 71.9 71.9 47.1 47.1
Buildings – owned
At cost 280.6 280.9 222.9 235.6
Less: accumulated depreciation 99.7 85.7 73.8 67.1
180.9 195.2 149.1 168.5
Buildings – leased
At cost 59.0 58.4 –29.0
Less: accumulated amortisation 47.4 45.7 –20.5
11.6 12.7 –8.5
Total buildings
At cost 339.6 339.3 222.9 264.6
Less: accumulated depreciation and amortisation 147.1 131.4 73.8 87.6
Total buildings at net book value 192.5 207.9 149.1 177.0
Leasehold improvements
At cost 1,361.4 1,331.5 810.8 832.8
Less: accumulated amortisation 820.2 767.9 432.4 428.6
Total leasehold improvements at net book value 541.2 563.6 378.4 404.2
Plant and equipment – owned
At cost 1,230.2 1,291.4 795.3 1,039.1
Less: accumulated depreciation 679.1 779.3 464.8 607.1
551.1 512.1 330.5 432.0
Plant and equipment – leased
At cost 1.1 6.7 ––
Less: accumulated amortisation 1.1 6.7 ––
––––
Total plant and equipment
At cost 1,231.3 1,298.1 795.3 1,039.1
Less: accumulated depreciation and amortisation 680.2 786.0 464.8 607.1
Total plant and equipment at net book value 551.1 512.1 330.5 432.0
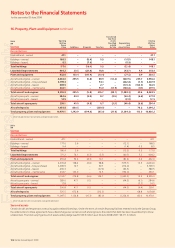
16. Property, Plant and Equipment
For personal use only