Foot Locker 2014 Annual Report Download - page 94
Download and view the complete annual report
Please find page 94 of the 2014 Foot Locker annual report below. You can navigate through the pages in the report by either clicking on the pages listed below, or by using the keyword search tool below to find specific information within the annual report.-
 1
1 -
2
-
3
-
4
-
5
-
6
-
7
-
8
-
9
-
10
-
11
-
12
-
13
-
14
-
15
-
16
-
17
-
18
-
19
-
20
-
21
-
22
-
23
-
24
-
25
-
26
-
27
-
28
-
29
-
30
-
31
-
32
-
33
-
34
-
35
-
36
-
37
-
38
-
39
-
40
-
41
-
42
-
43
-
44
-
45
-
46
-
47
-
48
-
49
-
50
-
51
-
52
-
53
-
54
-
55
-
56
-
57
-
58
-
59
-
60
-
61
-
62
-
63
-
64
-
65
-
66
-
67
-
68
-
69
-
70
-
71
-
72
-
73
-
74
-
75
-
76
-
77
-
78
-
79
-
80
-
81
-
82
-
83
-
 84
84 -
 85
85 -
 86
86 -
 87
87 -
 88
88 -
 89
89 -
 90
90 -
 91
91 -
 92
92 -
 93
93 -
 94
94 -
 95
95 -
 96
96 -
 97
97 -
 98
98 -
 99
99 -
 100
100 -
 101
101 -
 102
102 -
 103
103 -
 104
104 -
105
-
106
-
107
-
108
-
109
-
110
-
111
-
112
 |
 |

FOOT LOCKER, INC.
NOTES TO CONSOLIDATED FINANCIAL STATEMENTS
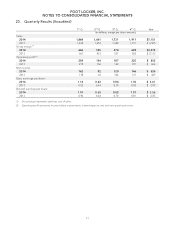
23. Quarterly Results (Unaudited)
1
st
Q2
nd
Q3
rd
Q4
th
Q Year
(in millions, except per share amounts)
Sales
2014 1,868 1,641 1,731 1,911 $7,151
2013 1,638 1,454 1,622 1,791 $ 6,505
Gross margin
(1)
2014 646 525 574 629 $2,374
2013 561 453 537 582 $ 2,133
Operating profit
(2)
2014 254 144 187 220 $ 805
2013 215 106 162 181 $ 664
Net income
2014 162 92 120 146 $ 520
2013 138 66 104 121 $ 429
Basic earnings per share:
2014 1.12 0.63 0.84 1.03 $ 3.61
2013 0.92 0.44 0.70 0.83 $ 2.89
Diluted earnings per share:
2014 1.10 0.63 0.82 1.01 $ 3.56
2013 0.90 0.44 0.70 0.81 $ 2.85
(1) Gross margin represents sales less cost of sales.
(2) Operating profit represents income before income taxes, interest expense, net, and non-operating income.
71