Foot Locker 2014 Annual Report Download - page 42
Download and view the complete annual report
Please find page 42 of the 2014 Foot Locker annual report below. You can navigate through the pages in the report by either clicking on the pages listed below, or by using the keyword search tool below to find specific information within the annual report.-
 1
1 -
2
-
3
-
4
-
5
-
6
-
7
-
8
-
9
-
10
-
11
-
12
-
13
-
14
-
15
-
16
-
17
-
18
-
19
-
20
-
21
-
22
-
23
-
24
-
25
-
26
-
27
-
28
-
29
-
30
-
31
-
 32
32 -
 33
33 -
 34
34 -
 35
35 -
 36
36 -
 37
37 -
 38
38 -
 39
39 -
 40
40 -
 41
41 -
 42
42 -
 43
43 -
 44
44 -
 45
45 -
 46
46 -
 47
47 -
 48
48 -
 49
49 -
 50
50 -
 51
51 -
 52
52 -
53
-
54
-
55
-
56
-
57
-
58
-
59
-
60
-
61
-
62
-
63
-
64
-
65
-
66
-
67
-
68
-
69
-
70
-
71
-
72
-
73
-
74
-
75
-
76
-
77
-
78
-
79
-
80
-
81
-
82
-
83
-
84
-
85
-
86
-
87
-
88
-
89
-
90
-
91
-
92
-
93
-
94
-
95
-
96
-
97
-
98
-
99
-
100
-
101
-
102
-
103
-
104
-
105
-
106
-
107
-
108
-
109
-
110
-
111
-
112
 |
 |

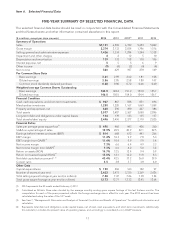
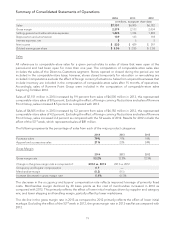
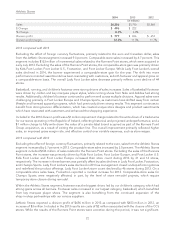
Summary of Consolidated Statements of Operations
2014 2013 2012
(in millions, except per share data)
Sales $7,151 $6,505 $6,182
Gross margin 2,374 2,133 2,034
Selling, general and administrative expenses 1,426 1,334 1,294
Depreciation and amortization 139 133 118
Interest expense, net 555
Net income $ 520 $ 429 $ 397
Diluted earnings per share $ 3.56 $ 2.85 $ 2.58
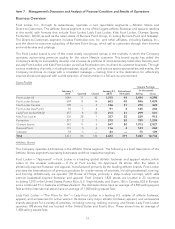
Sales
All references to comparable-store sales for a given period relate to sales of stores that were open at the
period-end and had been open for more than one year. The computation of comparable-store sales also
includes the sales of the Direct-to-Customers segment. Stores opened or closed during the period are not
included in the comparable-store base; however, stores closed temporarily for relocation or remodeling are
included. Computations exclude the effect of foreign currency fluctuations. Sales from acquired businesses that
include inventory are included in the computation of comparable-store sales after 15 months of operations.
Accordingly, sales of Runners Point Group were included in the computation of comparable-store sales
beginning October 2014.
Sales of $7,151 million in 2014 increased by 9.9 percent from sales of $6,505 million in 2013, this represented
comparable-store sales of 8.0 percent. Excluding the effect of foreign currency fluctuations and sales of Runners
Point Group, sales increased 8.5 percent as compared with 2013.
Sales of $6,505 million in 2013 increased by 5.2 percent from sales of $6,182 million in 2012, this represented
comparable-store sales of 4.2 percent. Excluding the effect of foreign currency fluctuations and sales of Runners
Point Group, sales increased 2.4 percent as compared with the 53 weeks of 2012. Results for 2012 include the
effect of the 53
rd
week, which represented sales of $81 million.
The following represents the percentage of sales from each of the major product categories:
2014 2013 2012
Footwear sales 79% 77% 76%
Apparel and accessories sales 21% 23% 24%
Gross Margin
2014 2013 2012
Gross margin rate 33.2% 32.8% 32.9%
Change in the gross margin rate is comprised of: 2014 vs. 2013 2013 vs. 2012
Occupancy and buyers’ compensation 0.7 —
Merchandise margin (0.3) (0.1)
Increase (decrease) in gross margin rate 0.4% (0.1)%
The decrease in the occupancy and buyers’ compensation rate reflects improved leverage of primarily fixed
costs. Merchandise margin declined by 30 basis points as the cost of merchandise increased in 2014 as
compared with 2013. This primarily reflects the effect of lower initial markups driven by supplier and category
mix, and lower shipping and handling margin, partially offset by lower markdowns.
The decline in the gross margin rate in 2013 as compared to 2012 primarily reflects the effect of lower initial
markups. Excluding the effect of the 53
rd
week in 2012, the gross margin rate in 2013 was flat as compared with
2012.
19