Foot Locker 2014 Annual Report Download - page 88
Download and view the complete annual report
Please find page 88 of the 2014 Foot Locker annual report below. You can navigate through the pages in the report by either clicking on the pages listed below, or by using the keyword search tool below to find specific information within the annual report.-
 1
1 -
2
-
3
-
4
-
5
-
6
-
7
-
8
-
9
-
10
-
11
-
12
-
13
-
14
-
15
-
16
-
17
-
18
-
19
-
20
-
21
-
22
-
23
-
24
-
25
-
26
-
27
-
28
-
29
-
30
-
31
-
32
-
33
-
34
-
35
-
36
-
37
-
38
-
39
-
40
-
41
-
42
-
43
-
44
-
45
-
46
-
47
-
48
-
49
-
50
-
51
-
52
-
53
-
54
-
55
-
56
-
57
-
58
-
59
-
60
-
61
-
62
-
63
-
64
-
65
-
66
-
67
-
68
-
69
-
70
-
71
-
72
-
73
-
74
-
75
-
76
-
77
-
 78
78 -
 79
79 -
 80
80 -
 81
81 -
 82
82 -
 83
83 -
 84
84 -
 85
85 -
 86
86 -
 87
87 -
 88
88 -
 89
89 -
 90
90 -
 91
91 -
 92
92 -
 93
93 -
 94
94 -
 95
95 -
 96
96 -
 97
97 -
 98
98 -
99
-
100
-
101
-
102
-
103
-
104
-
105
-
106
-
107
-
108
-
109
-
110
-
111
-
112
 |
 |

FOOT LOCKER, INC.
NOTES TO CONSOLIDATED FINANCIAL STATEMENTS
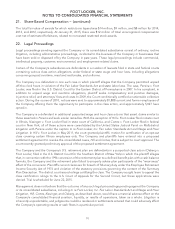
20. Retirement Plans and Other Benefits − (continued)
(5) This category consists of two fixed-income funds that invests primarily in intermediate duration bonds, as well as a combination of
other funds, that together are designed to exceed the performance of related indices.
(6) This category consists of one fund that invests in global real estate securities.
(7) This category consists primarily of cash related to net pending trade purchases and sales.
No Level 3 assets were held by the U.S. pension plan during 2014 and 2013.
The fair values of the Company’s Canadian pension plan assets at January 31, 2015 and February 1, 2014 were
as follows:
Level 1 Level 2 Level 3 2014
Total 2013
Total*
(in millions)
Cash and cash equivalents $ — $ 3 $ — $3 $—
Equity securities:
Canadian and international
(1)
5— — 55
Fixed-income securities:
Cash matched bonds
(2)
—65 —65 70
Total assets at fair value $ 5 $68 $ — $73 $75
* Each category of plan assets is classified within the same level of the fair value hierarchy for 2014 and 2013.
(1) This category comprises one mutual fund that invests primarily in a diverse portfolio of Canadian securities.
(2) This category consists of fixed-income securities, including strips and coupons, issued or guaranteed by the Government of Canada,
provinces or municipalities of Canada including their agencies and crown corporations, as well as other governmental bonds and
corporate bonds.
No Level 3 assets were held by the Canadian pension plan during 2014 and 2013.
During 2014, the Company made contributions of $6 million to its Canadian qualified pension plan. The
Company continuously evaluates the amount and timing of any future contributions. The Company currently
does not expect to contribute to its U.S. or Canadian qualified plans in 2015. Additional contributions will
depend on the plan asset performance and other factors. During 2014, the Company also paid $3 million in
pension benefits related to its non-qualified pension plans.
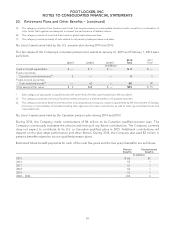
Estimated future benefit payments for each of the next five years and the five years thereafter are as follows:
Pension
Benefits Postretirement
Benefits
(in millions)
2015 $66 $1
2016 55 1
2017 53 1
2018 52 1
2019 53 1
2020 − 2024 232 5
65