Foot Locker 2014 Annual Report Download - page 48
Download and view the complete annual report
Please find page 48 of the 2014 Foot Locker annual report below. You can navigate through the pages in the report by either clicking on the pages listed below, or by using the keyword search tool below to find specific information within the annual report.-
 1
1 -
2
-
3
-
4
-
5
-
6
-
7
-
8
-
9
-
10
-
11
-
12
-
13
-
14
-
15
-
16
-
17
-
18
-
19
-
20
-
21
-
22
-
23
-
24
-
25
-
26
-
27
-
28
-
29
-
30
-
31
-
32
-
33
-
34
-
35
-
36
-
37
-
 38
38 -
 39
39 -
 40
40 -
 41
41 -
 42
42 -
 43
43 -
 44
44 -
 45
45 -
 46
46 -
 47
47 -
 48
48 -
 49
49 -
 50
50 -
 51
51 -
 52
52 -
 53
53 -
 54
54 -
 55
55 -
 56
56 -
 57
57 -
 58
58 -
59
-
60
-
61
-
62
-
63
-
64
-
65
-
66
-
67
-
68
-
69
-
70
-
71
-
72
-
73
-
74
-
75
-
76
-
77
-
78
-
79
-
80
-
81
-
82
-
83
-
84
-
85
-
86
-
87
-
88
-
89
-
90
-
91
-
92
-
93
-
94
-
95
-
96
-
97
-
98
-
99
-
100
-
101
-
102
-
103
-
104
-
105
-
106
-
107
-
108
-
109
-
110
-
111
-
112
 |
 |

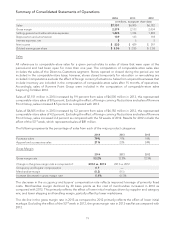
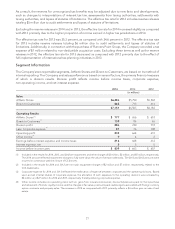
Maintaining access to merchandise that the Company considers appropriate for its business may be subject to
the policies and practices of its key suppliers. Therefore, the Company believes that it is critical to continue to
maintain satisfactory relationships with its key suppliers. In 2014 and 2013, the Company purchased
approximately 89 percent and 88 percent, respectively, of its merchandise from its top five suppliers and expects
to continue to obtain a significant percentage of its athletic product from these suppliers in future periods.
Approximately 73 percent in 2014 and 68 percent in 2013 was purchased from one supplier — Nike, Inc.
The Company’s 2015 planned capital expenditures and lease acquisition costs are approximately $220 million.
Planned capital expenditures are $218 million and planned lease acquisition costs related to the Company’s
operations in Europe are $2 million. The Company’s planned capital expenditures include $176 million related
to remodeling and expansion of existing stores and the planned opening of approximately 100 new stores
primarily related to Kids Foot Locker, European expansion, and SIX:02. Additionally, the planned spending
includes $42 million for the development of information systems and infrastructure, including a new
e-commerce order management system, point of sale device enhancements, and further rollout of our
merchandise allocation system. The Company has the ability to revise and reschedule much of the anticipated
capital expenditure program, should the Company’s financial position require it.
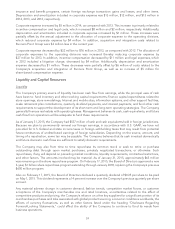
Free Cash Flow (non-GAAP measure)
In addition to net cash provided by operating activities, the Company uses free cash flow as a useful measure
of performance and as an indication of the strength of the Company and its ability to generate cash. The
Company defines free cash flow as net cash provided by operating activities less capital expenditures (which is
classified as an investing activity). The Company believes the presentation of free cash flow is relevant and
useful for investors because it allows investors to evaluate the cash generated from the Company’s underlying
operations in a manner similar to the method used by management.
Free cash flow is not defined under U.S. GAAP. Therefore, it should not be considered a substitute for income
or cash flow data prepared in accordance with U.S. GAAP, and may not be comparable to similarly titled
measures used by other companies. It should not be inferred that the entire free cash flow amount is available
for discretionary expenditures.
The following table presents a reconciliation of the Company’s net cash flow provided by operating activities,
the most directly comparable U.S. GAAP financial measure, to free cash flow.
2014 2013 2012
(in millions)
Net cash provided by operating activities $ 712 $ 530 $ 416
Capital expenditures (190) (206) (163)
Free cash flow (non-GAAP) $ 522 $ 324 $ 253
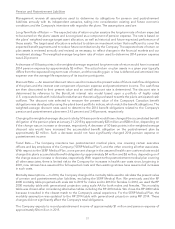
Operating Activities
2014 2013 2012
(in millions)
Net cash provided by operating activities $712 $530 $416
$ Change $182 $114
The amount provided by operating activities reflects income adjusted for non-cash items and working capital
changes. Adjustments to net income for non-cash items include non-cash impairment charges, depreciation
and amortization, deferred income taxes, share-based compensation expense and related tax benefits. The
improvement in 2014 represented the Company’s earnings strength and working capital improvements. During
2014, the Company contributed $6 million to its Canadian qualified pension plans as compared with $2 million
contributed in 2013. Cash paid for income taxes was $251 million for 2014 as compared with $175 million for
2013.
The improvement in 2013 as compared with 2012 also reflected the Company’s earnings strength. During 2012,
the Company contributed $25 million and $1 million to its U.S. and Canadian qualified pension plans,
respectively. Cash paid for income taxes was $175 million for 2013 as compared with $230 million for 2012.
25