Foot Locker 2014 Annual Report Download - page 40
Download and view the complete annual report
Please find page 40 of the 2014 Foot Locker annual report below. You can navigate through the pages in the report by either clicking on the pages listed below, or by using the keyword search tool below to find specific information within the annual report.-
 1
1 -
2
-
3
-
4
-
5
-
6
-
7
-
8
-
9
-
10
-
11
-
12
-
13
-
14
-
15
-
16
-
17
-
18
-
19
-
20
-
21
-
22
-
23
-
24
-
25
-
26
-
27
-
28
-
29
-
 30
30 -
 31
31 -
 32
32 -
 33
33 -
 34
34 -
 35
35 -
 36
36 -
 37
37 -
 38
38 -
 39
39 -
 40
40 -
 41
41 -
 42
42 -
 43
43 -
 44
44 -
 45
45 -
 46
46 -
 47
47 -
 48
48 -
 49
49 -
 50
50 -
51
-
52
-
53
-
54
-
55
-
56
-
57
-
58
-
59
-
60
-
61
-
62
-
63
-
64
-
65
-
66
-
67
-
68
-
69
-
70
-
71
-
72
-
73
-
74
-
75
-
76
-
77
-
78
-
79
-
80
-
81
-
82
-
83
-
84
-
85
-
86
-
87
-
88
-
89
-
90
-
91
-
92
-
93
-
94
-
95
-
96
-
97
-
98
-
99
-
100
-
101
-
102
-
103
-
104
-
105
-
106
-
107
-
108
-
109
-
110
-
111
-
112
 |
 |
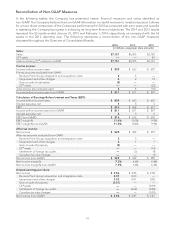
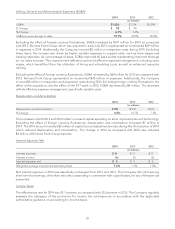
The Company estimates the tax effect of the non-GAAP adjustments by applying its marginal tax rate to each
of the respective items.
During 2013 and 2012, the Company recorded benefits of $3 million and $9 million, or $0.02 per diluted share
and $0.06 per diluted share, respectively, to reflect the settlement of foreign tax audits, which resulted in a
reduction in tax reserves established in prior periods. Additionally, in 2012, the Company recorded a benefit of
$1 million, or $0.01 per diluted share, to reflect the repeal of the last two stages of certain Canadian provincial
tax rate changes.
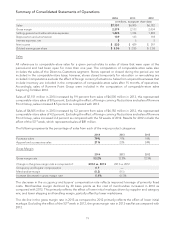
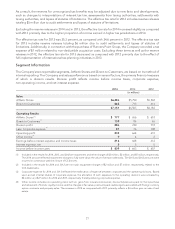
When assessing Return on Invested Capital (‘‘ROIC’’), the Company adjusts its results to reflect its operating
leases as if they qualified for capital lease treatment. Operating leases are the primary financing vehicle used
to fund store expansion and, therefore, we believe that the presentation of these leases as if they were capital
leases is appropriate. Accordingly, the asset base and net income amounts are adjusted to reflect this in the
calculation of ROIC. ROIC, subject to certain adjustments, is also used as a measure in executive long-term
incentive compensation.
The closest U.S. GAAP measure is Return on Assets (‘‘ROA’’) and is also represented below. ROA increased to
14.7 percent as compared with 12.5 percent in the prior year reflecting the Company’s overall strong
performance in 2014. Our ROIC improvement is due to an increase in our earnings before interest and income
taxes, partially offset by an increase in our average invested capital, primarily related to an increase in
capitalized operating leases. This reflected the effect of opening larger stores, and resulting additional rent,
supporting the various shop-in-shop initiatives.
2014 2013 2012
ROA
(1)
14.7% 12.5% 12.4%
ROIC% (non-GAAP)
(2)
15.0% 14.1% 14.2%
(1) Represents net income of $520 million, $429 million, and $397 million divided by average total assets of $3,532 million, $3,427 million,
and $3,209 million for 2014, 2013, and 2012, respectively.
(2) See below for the calculation of ROIC.
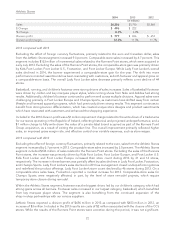
2014 2013 2012
(in millions)
EBIT (non-GAAP) $ 816 $ 676 $ 602
+ Rent expense 635 600 560
- Estimated depreciation on capitalized operating leases
(3)
(482) (443) (409)
Net operating profit 969 833 753
- Adjusted income tax expense
(4)
(347) (298) (274)
= Adjusted return after taxes $ 622 $ 535 $ 479
Average total assets $ 3,532 $ 3,427 $ 3,209
- Average cash, cash equivalents and short-term investments (917) (898) (890)
- Average non-interest bearing current liabilities (659) (630) (592)
- Average merchandise inventories (1,235) (1,194) (1,118)
+ Average estimated asset base of capitalized operating leases
(3)
2,093 1,829 1,552
+ 13-month average merchandise inventories 1,325 1,269 1,200
= Average invested capital $ 4,139 $ 3,803 $ 3,361
ROIC% 15.0% 14.1% 14.2%
(3) The determination of the capitalized operating leases and the adjustments to income have been calculated on a lease-by-lease basis
and have been consistently calculated in each of the years presented above. Capitalized operating leases represent the best estimate
of the asset base that would be recorded for operating leases as if they had been classified as capital or as if the property were
purchased. The present value of operating leases is discounted using various interest rates ranging from 2.8 percent to 14.5 percent,
which represent the Company’s incremental borrowing rate at inception of the lease.
(4) The adjusted income tax expense represents the marginal tax rate applied to net operating profit for each of the periods presented.
17