Foot Locker 2014 Annual Report Download - page 4
Download and view the complete annual report
Please find page 4 of the 2014 Foot Locker annual report below. You can navigate through the pages in the report by either clicking on the pages listed below, or by using the keyword search tool below to find specific information within the annual report.-
 1
1 -
 2
2 -
 3
3 -
 4
4 -
 5
5 -
 6
6 -
 7
7 -
 8
8 -
 9
9 -
 10
10 -
 11
11 -
 12
12 -
 13
13 -
 14
14 -
 15
15 -
16
-
17
-
18
-
19
-
20
-
21
-
22
-
23
-
24
-
25
-
26
-
27
-
28
-
29
-
30
-
31
-
32
-
33
-
34
-
35
-
36
-
37
-
38
-
39
-
40
-
41
-
42
-
43
-
44
-
45
-
46
-
47
-
48
-
49
-
50
-
51
-
52
-
53
-
54
-
55
-
56
-
57
-
58
-
59
-
60
-
61
-
62
-
63
-
64
-
65
-
66
-
67
-
68
-
69
-
70
-
71
-
72
-
73
-
74
-
75
-
76
-
77
-
78
-
79
-
80
-
81
-
82
-
83
-
84
-
85
-
86
-
87
-
88
-
89
-
90
-
91
-
92
-
93
-
94
-
95
-
96
-
97
-
98
-
99
-
100
-
101
-
102
-
103
-
104
-
105
-
106
-
107
-
108
-
109
-
110
-
111
-
112
 |
 |
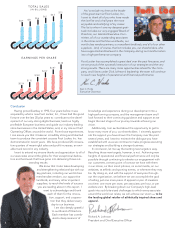
It is a tremendous privilege and honor to have the opportu-
nity to write this, my rst letter to shareholders as Chief Execu-
tive Ofcer of Foot Locker, Inc. I am both humbled and proud
to have been selected as the leader of the high-performing
team we have at Foot Locker. That the team is strong, there
can be no doubt: 2014 was the fourth consecutive year that
the Company’s sales and prot results represented the high-
est levels ever achieved in our history as an athletic footwear
and apparel business. We have continued to build on our
strengths, seize opportunities to set records in our nancial
and operational performance, and identify exciting initiatives
to grow the business in the future. In the remainder of this let-
ter and the pages that follow, I will share both the details of our
2014 performance and the Company’s strategic priorities for
the next several years.
Before I do that, however, I must acknowledge the excep-
tional contributions of Ken Hicks, who is retiring as Executive
Chairman of our Board in May 2015 and who served as Presi-
dent and Chief Executive Ofcer until this past December.
It was under Ken’s leadership that our senior executive team:
identied and articulated the key strategies to improve our
business performance; rst dared to set objectives beyond
anything that the Company had achieved before; and con-
sistently executed our initiatives so well that we have again
reached and surpassed many of the nancial objectives we set
for ourselves.
Ken has been an inspirational leader to everyone, as well
as a friend, coach, and mentor to me. On behalf of our Board
of Directors and the entire team at Foot Locker, I would like
to offer Ken our deepest gratitude for his contributions to our
Company over the last several years, and wish him all the best
in his retirement.
As Ken and the Board have passed the responsibilities
of Chief Executive Ofcer to me, the primary theme of this
leadership transition is one of continuity. Our team remains
focused on our vision: to be the leading global retailer of
athletically inspired shoes and apparel. The strategic priori-
ties that we describe throughout this report are also an evolu-
tion of the fundamental strategies that have led to our recent
strong results.
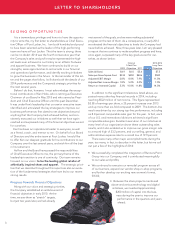
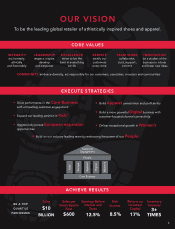
Progress Towards Financial Objectives
Along with our vision and strategic priorities,
the Company established an ambitious set of
nancial objectives in early 2010. At the
time, we saw them as “stretch” targets,
but just two years later, we had already
met several of the goals, and we were making substantial
progress on the rest of them. As a consequence, in early 2012
we elevated the nancial objectives to levels the Company had
never before achieved. Now, three years later, I am very pleased
to report that we continue to make excellent progress and have,
once again, surpassed many of the key goals we set for our-
selves, as shown below:
Original 2012-2016
5-Year Plan Long-Term
2009 Objectives 2011 2014 Objectives
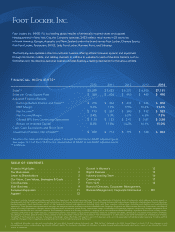
Sales (billions) $4.9 $6.0 $5.6 $7.2 $7.5
Sales per Gross Square Foot $333 $400 $406 $490 $500
Adjusted EBIT Margin 2.8% 8.0% 7.9% 11.4% 11.0%
Adjusted Net Income Margin 1.8% 5.0% 5.0% 7.3% 7.0%
Return on Invested Capital 5.3% 10.0% 11.8% 15.0% 14.0%
In addition to the signicant milestones listed above, we
posted many other key nancial records in 2014, including
reaching $522 million of net income. This gure represented
$3.58 of earnings per share, a 25 percent increase over 2013
and up more than six-fold compared to 2009. This bottom-line
result was driven by our strong top-line performance, including
an 8.0 percent comparable sales gain for the year. In fact, each
of our U.S. and international divisions achieved a signicant
comparable sales gain. Excellent execution of our initiatives at
every level of our organization drove these outstanding sales
results, and it also enabled us to improve our gross margin rate
to a record high of 33.2 percent, and our selling, general, and
administrative expense rate to a record low of 19.9 percent.
There were many other major accomplishments during the
year; too many, in fact, to describe in this letter, but let me call
out just a few of the highlights of 2014:
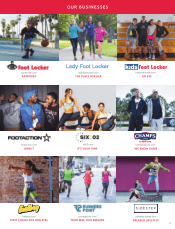
• We successfully completed the integration of Runners Point
Group into our Company, and it contributed meaningfully
to our sales and prots;
• We continued to execute our remodel program across all
of our banners, expand our vendor shop-in-shop programs,
and further develop our exciting new women’s format,
SIX:02;
• Between the store projects mentioned
above and various technology and digital
initiatives, we invested approximately
$200 million of capital into the busi-
ness during the year to improve our
performance in the quarters and years
ahead;
LETTER TO SHAREHOLDERS
3
SEIZING OPPORTUNITIES