Foot Locker 2014 Annual Report Download - page 103
Download and view the complete annual report
Please find page 103 of the 2014 Foot Locker annual report below. You can navigate through the pages in the report by either clicking on the pages listed below, or by using the keyword search tool below to find specific information within the annual report.-
 1
1 -
2
-
3
-
4
-
5
-
6
-
7
-
8
-
9
-
10
-
11
-
12
-
13
-
14
-
15
-
16
-
17
-
18
-
19
-
20
-
21
-
22
-
23
-
24
-
25
-
26
-
27
-
28
-
29
-
30
-
31
-
32
-
33
-
34
-
35
-
36
-
37
-
38
-
39
-
40
-
41
-
42
-
43
-
44
-
45
-
46
-
47
-
48
-
49
-
50
-
51
-
52
-
53
-
54
-
55
-
56
-
57
-
58
-
59
-
60
-
61
-
62
-
63
-
64
-
65
-
66
-
67
-
68
-
69
-
70
-
71
-
72
-
73
-
74
-
75
-
76
-
77
-
78
-
79
-
80
-
81
-
82
-
83
-
84
-
85
-
86
-
87
-
88
-
89
-
90
-
91
-
92
-
 93
93 -
 94
94 -
 95
95 -
 96
96 -
 97
97 -
 98
98 -
 99
99 -
 100
100 -
 101
101 -
 102
102 -
 103
103 -
 104
104 -
 105
105 -
 106
106 -
 107
107 -
 108
108 -
 109
109 -
 110
110 -
 111
111 -
 112
112
 |
 |
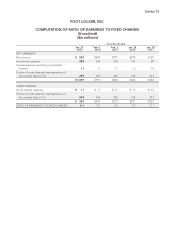
Exhibit 12
FOOT LOCKER, INC.
COMPUTATION OF RATIO OF EARNINGS TO FIXED CHARGES
(Unaudited)
($in millions)
Fiscal Year Ended
Jan. 31,
2015 Feb. 1,
2014 Feb. 2,
2013 Jan. 28,
2012 Jan. 29,
2011
NET EARNINGS
Net income $ 520 $429 $397 $278 $169
Income tax expense 289 234 210 157 88
Interest expense, excluding capitalized
interest 11 11 11 13 14
Portion of rents deemed representative of
the interest factor (1/3) 249 236 222 218 213
$1,069 $910 $840 $666 $484
FIXED CHARGES
Gross interest expense $11 $11 $11 $13 $14
Portion of rents deemed representative of
the interest factor (1/3) 249 236 222 218 213
$ 260 $247 $233 $231 $227
RATIO OF EARNINGS TO FIXED CHARGES 4.1 3.7 3.6 2.9 2.1