Foot Locker 2014 Annual Report Download - page 49
Download and view the complete annual report
Please find page 49 of the 2014 Foot Locker annual report below. You can navigate through the pages in the report by either clicking on the pages listed below, or by using the keyword search tool below to find specific information within the annual report.-
 1
1 -
2
-
3
-
4
-
5
-
6
-
7
-
8
-
9
-
10
-
11
-
12
-
13
-
14
-
15
-
16
-
17
-
18
-
19
-
20
-
21
-
22
-
23
-
24
-
25
-
26
-
27
-
28
-
29
-
30
-
31
-
32
-
33
-
34
-
35
-
36
-
37
-
38
-
 39
39 -
 40
40 -
 41
41 -
 42
42 -
 43
43 -
 44
44 -
 45
45 -
 46
46 -
 47
47 -
 48
48 -
 49
49 -
 50
50 -
 51
51 -
 52
52 -
 53
53 -
 54
54 -
 55
55 -
 56
56 -
 57
57 -
 58
58 -
 59
59 -
60
-
61
-
62
-
63
-
64
-
65
-
66
-
67
-
68
-
69
-
70
-
71
-
72
-
73
-
74
-
75
-
76
-
77
-
78
-
79
-
80
-
81
-
82
-
83
-
84
-
85
-
86
-
87
-
88
-
89
-
90
-
91
-
92
-
93
-
94
-
95
-
96
-
97
-
98
-
99
-
100
-
101
-
102
-
103
-
104
-
105
-
106
-
107
-
108
-
109
-
110
-
111
-
112
 |
 |

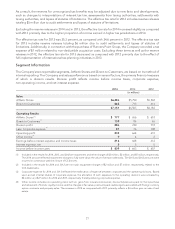
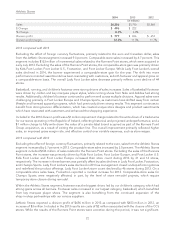
Investing Activities
2014 2013 2012
(in millions)
Net cash used in investing activities $176 $248 $212
$ Change $ (72) $36
Capital expenditures in 2014 were $190 million, primarily related to the remodeling of 319 stores, the build-out
of 86 new stores, and various corporate technology upgrades. This represented a decrease of $16 million as
compared with the prior year, as the timing of certain projects shifted to later in the current year. During 2014,
the Company sold real estate for proceeds of $5 million and recorded a gain on sale of $4 million. During 2014,
maturities of short-term investments totaled $9 million. This compares with net sales and maturities of
$37 million of short-term investments during 2013.
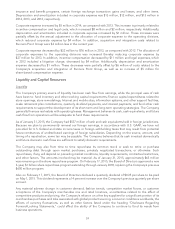
During 2013, the Company completed its purchase of Runners Point Group for $81 million, net of cash acquired.
Capital expenditures in 2013 were $206 million, primarily related to the remodeling of 320 stores, the build-out
of 84 new stores, and various corporate technology upgrades. This represented an increase of $43 million as
compared with 2012. Net sales and maturities of short-term investments were $37 million during 2013, as
compared with net purchases of $49 million during 2012.
Financing Activities
2014 2013 2012
(in millions)
Net cash used in financing activities $401 $309 $181
$ Change $92 $128
Cash used in financing activities consists primarily of the Company’s return to shareholders initiatives, including
its share repurchase program and cash dividend payments, as follows:
2014 2013 2012
(in millions)
Share repurchases $305 $229 $129
Dividends paid on common stock 127 118 109
Total returned to shareholders $432 $347 238
During 2014, 2013, and 2012, the Company repurchased 5,888,698 shares, 6,424,286 shares, and
4,000,161 shares of its common stock under its share repurchase programs. Additionally, the Company declared
and paid dividends representing a quarterly rate of $0.22, $0.20 and $0.18 per share in 2014, 2013, and 2012,
respectively.
Offsetting the amounts above were proceeds received from the issuance of common stock and treasury stock
in connection with the employee stock programs of $22 million, $30 million, and $48 million for 2014, 2013, and
2012, respectively. In connection with stock option exercises, the Company recorded excess tax benefits related
to share-based compensation of $12 million, $9 million, and $11 million for 2014, 2013, and 2012, respectively.
The activity during 2014 also reflected payments on capital lease obligations of $3 million, as compared with
$1 million during 2013. These obligations were recorded in connection with the acquisition of the Runners Point
Group.
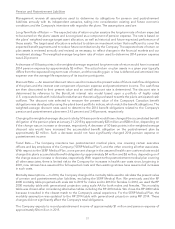
Capital Structure
The 2011 Restated Credit Agreement provides for a $200 million asset based revolving credit facility maturing
on January 27, 2017. In addition, during the term of the 2011 Restated Credit Agreement, the Company may
make up to four requests for additional credit commitments in an aggregate amount not to exceed $200 million.
Interest is based on the LIBOR rate in effect at the time of the borrowing plus a 1.25 to 1.50 percent margin
depending on certain provisions as defined in the 2011 Restated Credit Agreement.
26