Foot Locker 2014 Annual Report Download - page 65
Download and view the complete annual report
Please find page 65 of the 2014 Foot Locker annual report below. You can navigate through the pages in the report by either clicking on the pages listed below, or by using the keyword search tool below to find specific information within the annual report.-
 1
1 -
2
-
3
-
4
-
5
-
6
-
7
-
8
-
9
-
10
-
11
-
12
-
13
-
14
-
15
-
16
-
17
-
18
-
19
-
20
-
21
-
22
-
23
-
24
-
25
-
26
-
27
-
28
-
29
-
30
-
31
-
32
-
33
-
34
-
35
-
36
-
37
-
38
-
39
-
40
-
41
-
42
-
43
-
44
-
45
-
46
-
47
-
48
-
49
-
50
-
51
-
52
-
53
-
54
-
 55
55 -
 56
56 -
 57
57 -
 58
58 -
 59
59 -
 60
60 -
 61
61 -
 62
62 -
 63
63 -
 64
64 -
 65
65 -
 66
66 -
 67
67 -
 68
68 -
 69
69 -
 70
70 -
 71
71 -
 72
72 -
 73
73 -
 74
74 -
 75
75 -
76
-
77
-
78
-
79
-
80
-
81
-
82
-
83
-
84
-
85
-
86
-
87
-
88
-
89
-
90
-
91
-
92
-
93
-
94
-
95
-
96
-
97
-
98
-
99
-
100
-
101
-
102
-
103
-
104
-
105
-
106
-
107
-
108
-
109
-
110
-
111
-
112
 |
 |
FOOT LOCKER, INC.
NOTES TO CONSOLIDATED FINANCIAL STATEMENTS
1. Summary of Significant Accounting Policies − (continued)
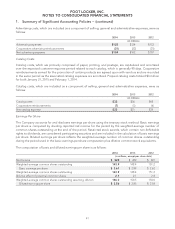
Potential common shares include the dilutive effect of stock options and restricted stock units. Options to
purchase 0.6 million, 1.0 million, and 0.8 million shares of common stock at January 31, 2015, February 1, 2014,
and February 2, 2013, respectively, were not included in the computations primarily because the exercise price
of the options was greater than the average market price of the common shares and, therefore, the effect of
their inclusion would be antidilutive. Contingently issuable shares of 0.3 million, 0.2 million, and 0.1 million at
January 31, 2015, February 1, 2014, and February 2, 2013, respectively, have not been included as the vesting
conditions have not been satisfied.
Share-Based Compensation
The Company recognizes compensation expense in the financial statements for share-based awards based on
the grant date fair value of those awards. Additionally, stock-based compensation expense includes an estimate
for pre-vesting forfeitures and is recognized over the requisite service periods of the awards. See Note 21,
Share-Based Compensation, for information on the assumptions the Company used to calculate the fair value
of share-based compensation.
Upon exercise of stock options, issuance of restricted stock or units, or issuance of shares under the employees
stock purchase plan, the Company will issue authorized but unissued common stock or use common stock held
in treasury. The Company may make repurchases of its common stock from time to time, subject to legal and
contractual restrictions, market conditions, and other factors.
Cash and Cash Equivalents
Cash equivalents at January 31, 2015 and February 1, 2014 were $930 million and $819 million, respectively.
Cash equivalents include amounts on demand with banks and all highly liquid investments with original
maturities of three months or less, including money market funds. Additionally, amounts due from third-party
credit card processors for the settlement of debit and credit card transactions are included as cash equivalents
as they are generally collected within three business days.
Investments
Changes in the fair value of available-for-sale securities are reported as a component of accumulated other
comprehensive loss in the Consolidated Statements of Shareholders’ Equity and are not reflected in the
Consolidated Statements of Operations until a sale transaction occurs or when declines in fair value are
deemed to be other-than-temporary. The Company routinely reviews available-for-sale securities for
other-than-temporary declines in fair value below the cost basis, and when events or changes in circumstances
indicate the carrying value of a security may not be recoverable, the security is written down to fair value. As of
January 31, 2015, the Company held $6 million of available-for-sale securities, which represented the Company’s
auction rate security. See Note 19, Fair Value Measurements, for further discussion of these investments.
Merchandise Inventories and Cost of Sales
Merchandise inventories for the Company’s Athletic Stores are valued at the lower of cost or market using the
retail inventory method. Cost for retail stores is determined on the last-in, first-out (‘‘LIFO’’) basis for domestic
inventories and on the first-in, first-out (‘‘FIFO’’) basis for international inventories.
The retail inventory method is commonly used by retail companies to value inventories at cost and calculate gross
margins due to its practicality. Under the retail inventory method, cost is determined by applying a
cost-to-retail percentage across groupings of similar items, known as departments. The cost-to-retail percentage is
applied to ending inventory at its current owned retail valuation to determine the cost of ending inventory on a
department basis. The Company provides reserves based on current selling prices when the inventory has not
been marked down to market. Merchandise inventories of the Direct-to-Customers business are valued at the
lower of cost or market using weighted-average cost, which approximates FIFO. Transportation, distribution center,
42