Foot Locker 2014 Annual Report Download - page 44
Download and view the complete annual report
Please find page 44 of the 2014 Foot Locker annual report below. You can navigate through the pages in the report by either clicking on the pages listed below, or by using the keyword search tool below to find specific information within the annual report.-
 1
1 -
2
-
3
-
4
-
5
-
6
-
7
-
8
-
9
-
10
-
11
-
12
-
13
-
14
-
15
-
16
-
17
-
18
-
19
-
20
-
21
-
22
-
23
-
24
-
25
-
26
-
27
-
28
-
29
-
30
-
31
-
32
-
33
-
 34
34 -
 35
35 -
 36
36 -
 37
37 -
 38
38 -
 39
39 -
 40
40 -
 41
41 -
 42
42 -
 43
43 -
 44
44 -
 45
45 -
 46
46 -
 47
47 -
 48
48 -
 49
49 -
 50
50 -
 51
51 -
 52
52 -
 53
53 -
 54
54 -
55
-
56
-
57
-
58
-
59
-
60
-
61
-
62
-
63
-
64
-
65
-
66
-
67
-
68
-
69
-
70
-
71
-
72
-
73
-
74
-
75
-
76
-
77
-
78
-
79
-
80
-
81
-
82
-
83
-
84
-
85
-
86
-
87
-
88
-
89
-
90
-
91
-
92
-
93
-
94
-
95
-
96
-
97
-
98
-
99
-
100
-
101
-
102
-
103
-
104
-
105
-
106
-
107
-
108
-
109
-
110
-
111
-
112
 |
 |

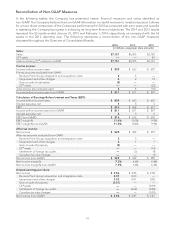
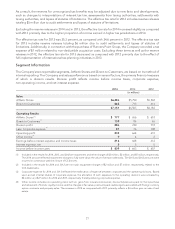
As a result, the reserves for unrecognized tax benefits may be adjusted due to new facts and developments,
such as changes to interpretations of relevant tax law, assessments from taxing authorities, settlements with
taxing authorities, and lapses of statutes of limitations. The effective tax rate for 2014 includes reserve releases
totaling $5 million due to audit settlements and lapses of statutes of limitations.
Excluding the reserve releases in 2014 and in 2013, the effective tax rate for 2014 increased slightly as compared
with 2013 primarily due to the higher proportion of income earned in higher tax jurisdictions in 2014.
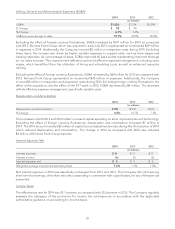
The effective tax rate for 2013 was 35.3 percent, as compared with 34.6 percent in 2012. The effective tax rate
for 2013 includes reserve releases totaling $6 million due to audit settlements and lapses of statutes of
limitations. Additionally, in connection with the purchase of Runners Point Group, the Company recorded a tax
expense of $1 million related to non-deductible acquisition costs. Excluding these items as well as the reserve
releases in 2012, the effective tax rate for 2013 decreased as compared with 2012 primarily due to the effect of
full implementation of international tax planning initiatives in 2013.
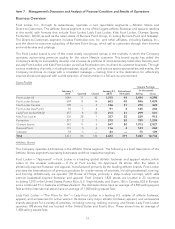
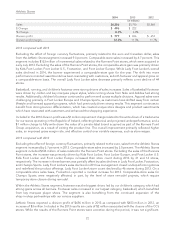
Segment Information
The Company’s two reportable segments, Athletic Stores and Direct-to-Customers, are based on its method of
internal reporting. The Company evaluates performance based on several factors, the primary financial measure
of which is division results. Division profit reflects income before income taxes, corporate expense,
non-operating income, and net interest expense.
2014 2013 2012
(in millions)
Sales
Athletic Stores $6,286 $5,790 $5,568
Direct-to-Customers 865 715 614
$7,151 $6,505 $6,182
Operating Results
Athletic Stores
(1)
$ 777 $ 656 $ 653
Direct-to-Customers(2) 109 84 65
Division profit 886 740 718
Less: Corporate expense (3) 81 76 108
Operating profit 805 664 610
Other income(4) 942
Earnings before interest expense and income taxes 814 668 612
Interest expense, net 555
Income before income taxes $ 809 $ 663 $ 607
(1) Included in the results for 2014, 2013, and 2012 are impairment and other charges of $2 million, $2 million, and $5 million, respectively.
The 2014 amount reflected impairment charges to fully write-down the value of certain trademarks. The 2013 and 2012 amounts were
incurred in connection with the closure of CCS stores.
(2) Included in the results for 2014 and 2012 are non-cash impairment charges of $2 million and $7 million, respectively, related to the
CCS trademarks.
(3) Corporate expense for 2014 and 2013 reflected the reallocation of expense between corporate and the operating divisions. Based
upon annual internal studies of corporate expense, the allocation of such expenses to the operating divisions was increased by
$4 million and $27 million for 2014 and 2013, respectively, thereby reducing corporate expense.
(4) Other income includes non-operating items such as: gains from insurance recoveries; discounts/premiums paid on the repurchase
and retirement of bonds; royalty income; and the changes in fair value, premiums paid, realized gains associated with foreign currency
option contracts and property sales. The increase in 2014 as compared with 2013 primarily reflects a $4 million gain on sale of real
estate.
21