Foot Locker 2014 Annual Report Download - page 45
Download and view the complete annual report
Please find page 45 of the 2014 Foot Locker annual report below. You can navigate through the pages in the report by either clicking on the pages listed below, or by using the keyword search tool below to find specific information within the annual report.-
 1
1 -
2
-
3
-
4
-
5
-
6
-
7
-
8
-
9
-
10
-
11
-
12
-
13
-
14
-
15
-
16
-
17
-
18
-
19
-
20
-
21
-
22
-
23
-
24
-
25
-
26
-
27
-
28
-
29
-
30
-
31
-
32
-
33
-
34
-
 35
35 -
 36
36 -
 37
37 -
 38
38 -
 39
39 -
 40
40 -
 41
41 -
 42
42 -
 43
43 -
 44
44 -
 45
45 -
 46
46 -
 47
47 -
 48
48 -
 49
49 -
 50
50 -
 51
51 -
 52
52 -
 53
53 -
 54
54 -
 55
55 -
56
-
57
-
58
-
59
-
60
-
61
-
62
-
63
-
64
-
65
-
66
-
67
-
68
-
69
-
70
-
71
-
72
-
73
-
74
-
75
-
76
-
77
-
78
-
79
-
80
-
81
-
82
-
83
-
84
-
85
-
86
-
87
-
88
-
89
-
90
-
91
-
92
-
93
-
94
-
95
-
96
-
97
-
98
-
99
-
100
-
101
-
102
-
103
-
104
-
105
-
106
-
107
-
108
-
109
-
110
-
111
-
112
 |
 |
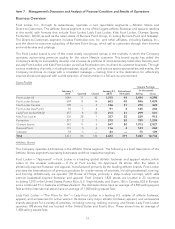
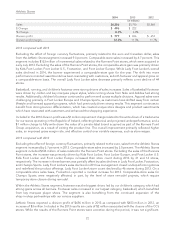
Athletic Stores
2014 2013 2012
(in millions)
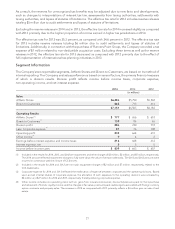
Sales $6,286 $5,790 $5,568
$ Change $ 496 $ 222
% Change 8.6% 4.0%
Division profit $ 777 $ 656 $ 653
Division profit margin 12.4% 11.3% 11.7%
2014 compared with 2013
Excluding the effect of foreign currency fluctuations, primarily related to the euro and Canadian dollar, sales
from the Athletic Stores segment increased 9.4 percent. Comparable-store sales increased by 6.7 percent. This
segment includes $133 million of incremental sales related to the Runners Point stores, which were acquired in
early July 2013. Excluding the sales of the Runners Point stores, the comparable-store gain was primarily driven
by Kids Foot Locker, Foot Locker U.S., Footaction, and Foot Locker Europe. While Lady Foot Locker’s overall
sales declined in 2014, the banner experienced a comparable-store gain for the year. The shift into more
performance oriented assortments has been resonating with customers, as both footwear and apparel grew on
a comparable-store basis. The overall Lady Foot Locker sales decrease primarily reflects a net decline of 44
stores.
Basketball, running, and children’s footwear were strong drivers of sales increases. Sales of basketball footwear
were driven by Jordan and key marquee player styles, while running shoes from Nike and Adidas had strong
results. Additionally, children’s footwear continued to perform well across multiple divisions. Apparel sales were
challenging primarily in Foot Locker Europe and Champs Sports, as customers have shifted away from certain
lifestyle and licensed apparel programs, which had previously driven strong results. This segment continues to
benefit from strong banner differentiation, which has created unique store designs and product assortments
which have resonated with customers and enhanced the shopping experience.
Included in the 2014 division profit was a $1 million impairment charge related to the write-down of a tradename
for our stores operating in the Republic of Ireland, reflecting historical and projected underperformance, and a
$1 million charge to fully write down the value of a private-label brand acquired as part of the Runners Point
Group acquisition, as a result of exiting the product line. The overall improvement primarily reflected higher
sales, an improved gross margin rate, and effective control over variable expenses, such as store wages.
2013 compared with 2012
Excluding the effect of foreign currency fluctuations, primarily related to the euro, sales from the Athletic Stores
segment increased by 3.7 percent in 2013. Comparable-store sales increased by 3.0 percent. The Athletic Stores
segment included $146 million of sales related to the Runners Point stores. Excluding the sales of the Runners
Point stores, the increase was primarily driven by Kids Foot Locker, Foot Locker Europe, and Foot Locker U.S.
Kids Foot Locker and Foot Locker Europe increased their store count during 2013 by 31 and 14 stores,
respectively. The increase in these banners was partially offset by sales declines in Lady Foot Locker, Footaction,
and Champs Sports. Lady Foot Locker’s sales declined in 2013 as management closed underperforming stores
and redefined the product offerings. Lady Foot Locker’s store count declined by 46 stores during 2013. On a
comparable-store sales basis, Footaction reported a modest increase for 2013. Comparable-store sales for
Champs Sports were negatively affected, in part, by the level of store remodel projects, which require
temporary store closure during remodel.
Within the Athletic Stores segment, footwear was the biggest driver, led by our children’s category, which had
strong gains across all banners. Footwear sales increased in our largest category, basketball, which benefited
from key marquee player shoes. The segment is also benefiting from the continued expansion of the
shop-in-shop partnerships with our various suppliers.
Athletic Stores reported a division profit of $656 million in 2013 as compared with $653 million in 2012, an
increase of $3 million. Included in the 2013 results are costs of $2 million associated with the closure of the CCS
stores. While the results of the Runners Point stores were accretive during the period, it was not significant.
22