Foot Locker 2014 Annual Report Download - page 39
Download and view the complete annual report
Please find page 39 of the 2014 Foot Locker annual report below. You can navigate through the pages in the report by either clicking on the pages listed below, or by using the keyword search tool below to find specific information within the annual report.-
 1
1 -
2
-
3
-
4
-
5
-
6
-
7
-
8
-
9
-
10
-
11
-
12
-
13
-
14
-
15
-
16
-
17
-
18
-
19
-
20
-
21
-
22
-
23
-
24
-
25
-
26
-
27
-
28
-
 29
29 -
 30
30 -
 31
31 -
 32
32 -
 33
33 -
 34
34 -
 35
35 -
 36
36 -
 37
37 -
 38
38 -
 39
39 -
 40
40 -
 41
41 -
 42
42 -
 43
43 -
 44
44 -
 45
45 -
 46
46 -
 47
47 -
 48
48 -
 49
49 -
50
-
51
-
52
-
53
-
54
-
55
-
56
-
57
-
58
-
59
-
60
-
61
-
62
-
63
-
64
-
65
-
66
-
67
-
68
-
69
-
70
-
71
-
72
-
73
-
74
-
75
-
76
-
77
-
78
-
79
-
80
-
81
-
82
-
83
-
84
-
85
-
86
-
87
-
88
-
89
-
90
-
91
-
92
-
93
-
94
-
95
-
96
-
97
-
98
-
99
-
100
-
101
-
102
-
103
-
104
-
105
-
106
-
107
-
108
-
109
-
110
-
111
-
112
 |
 |

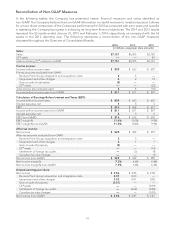
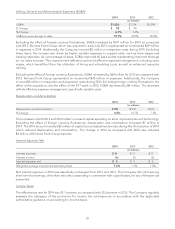
Reconciliation of Non-GAAP Measures
In the following tables, the Company has presented certain financial measures and ratios identified as
non-GAAP. The Company believes this non-GAAP information is a useful measure to investors because it allows
for a more direct comparison of the Company’s performance for 2014 as compared with prior years and is useful
in assessing the Company’s progress in achieving its long-term financial objectives. The 2014 and 2013 results
represent the 52 weeks ended January 31, 2015 and February 1, 2014, respectively, as compared with the 53
weeks in the 2012 reporting year. The following represents a reconciliation of the non-GAAP measures
discussed throughout the Overview of Consolidated Results:
2014 2013 2012
(in millions, except per share amounts)
Sales:
Sales $7,151 $6,505 $6,182
53
rd
week ——81
Sales excluding 53
rd
week (non-GAAP) $7,151 $6,505 $6,101
Pre-tax income:
Income before income taxes $ 809 $ 663 $ 607
Pre-tax amounts excluded from GAAP:
Runners Point Group integration and acquisition costs 26—
Impairment and other charges 4212
Gain on sale of real estate (4) ——
53
rd
week —— (22)
Total pre-tax amounts excluded 28 (10)
Income before income taxes (non-GAAP) $ 811 $ 671 $ 597
Calculation of Earnings Before Interest and Taxes (EBIT):
Income before income taxes $ 809 $ 663 $ 607
Interest expense, net 555
EBIT $ 814 $ 668 $ 612
Income before income taxes (non-GAAP) $ 811 $ 671 $ 597
Interest expense, net 555
EBIT (non-GAAP) $ 816 $ 676 $ 602
EBIT margin% 11.4% 10.3% 9.9%
EBIT margin% (non-GAAP) 11.4% 10.4% 9.9%
After-tax income:
Net income $ 520 $ 429 $ 397
After-tax amounts excluded from GAAP:
Runners Point Group acquisition and integration costs 25—
Impairment and other charges 317
Gain on sale of property (3) ——
53
rd
week —— (14)
Settlement of foreign tax audits —(3) (9)
Canadian tax rate changes —— (1)
Net income (non-GAAP) $ 522 $ 432 $ 380
Net income margin% 7.3% 6.6% 6.4%
Net income margin% (non-GAAP) 7.3% 6.6% 6.2%
Diluted earnings per share:
Net income $ 3.56 $ 2.85 $ 2.58
Runners Point Group acquisition and integration costs 0.01 0.03 —
Impairment and other charges 0.02 0.01 0.05
Gain on sale of property (0.01) ——
53
rd
week —— (0.09)
Settlement of foreign tax audits —(0.02) (0.06)
Canadian tax rate changes —— (0.01)
Net income (non-GAAP) $ 3.58 $ 2.87 $ 2.47
16