Foot Locker 2014 Annual Report Download - page 70
Download and view the complete annual report
Please find page 70 of the 2014 Foot Locker annual report below. You can navigate through the pages in the report by either clicking on the pages listed below, or by using the keyword search tool below to find specific information within the annual report.-
 1
1 -
2
-
3
-
4
-
5
-
6
-
7
-
8
-
9
-
10
-
11
-
12
-
13
-
14
-
15
-
16
-
17
-
18
-
19
-
20
-
21
-
22
-
23
-
24
-
25
-
26
-
27
-
28
-
29
-
30
-
31
-
32
-
33
-
34
-
35
-
36
-
37
-
38
-
39
-
40
-
41
-
42
-
43
-
44
-
45
-
46
-
47
-
48
-
49
-
50
-
51
-
52
-
53
-
54
-
55
-
56
-
57
-
58
-
59
-
 60
60 -
 61
61 -
 62
62 -
 63
63 -
 64
64 -
 65
65 -
 66
66 -
 67
67 -
 68
68 -
 69
69 -
 70
70 -
 71
71 -
 72
72 -
 73
73 -
 74
74 -
 75
75 -
 76
76 -
 77
77 -
 78
78 -
 79
79 -
 80
80 -
81
-
82
-
83
-
84
-
85
-
86
-
87
-
88
-
89
-
90
-
91
-
92
-
93
-
94
-
95
-
96
-
97
-
98
-
99
-
100
-
101
-
102
-
103
-
104
-
105
-
106
-
107
-
108
-
109
-
110
-
111
-
112
 |
 |
FOOT LOCKER, INC.
NOTES TO CONSOLIDATED FINANCIAL STATEMENTS
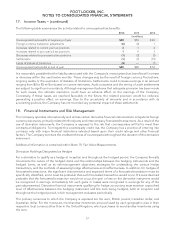
2. Segment Information − (continued)
2014 2013 2012
(in millions)
Operating Results
Athletic Stores
(1)
$777 $656 $653
Direct-to-Customers
(2)
109 84 65
Division profit 886 740 718
Less: Corporate expense
(3)
81 76 108
Operating profit 805 664 610
Other income 942
Interest expense, net 555
Income before income taxes $809 $663 $607
(1) Included in the results for 2014, 2013, and 2012 are impairment and other charges of $2 million, $2 million, and $5 million, respectively.
The 2014 amount reflected impairment charges to fully write-down the value of certain trademarks. The 2013 and 2012 amounts were
incurred in connection with the closure of CCS stores. See Note 3, Impairment and Other Charges for additional information.
(2) Included in the results for 2014 and 2012 are non-cash impairment charges of $2 million and $7 million, respectively, related to the
CCS trademarks. See Note 3, Impairment and Other Charges for additional information.
(3) Corporate expense for 2014 and 2013 reflected the reallocation of expense between corporate and the operating divisions. Based
upon annual internal studies of corporate expense, the allocation of such expenses to the operating divisions was increased by
$4 million and $27 million for 2014 and 2013, respectively, thereby reducing corporate expense.
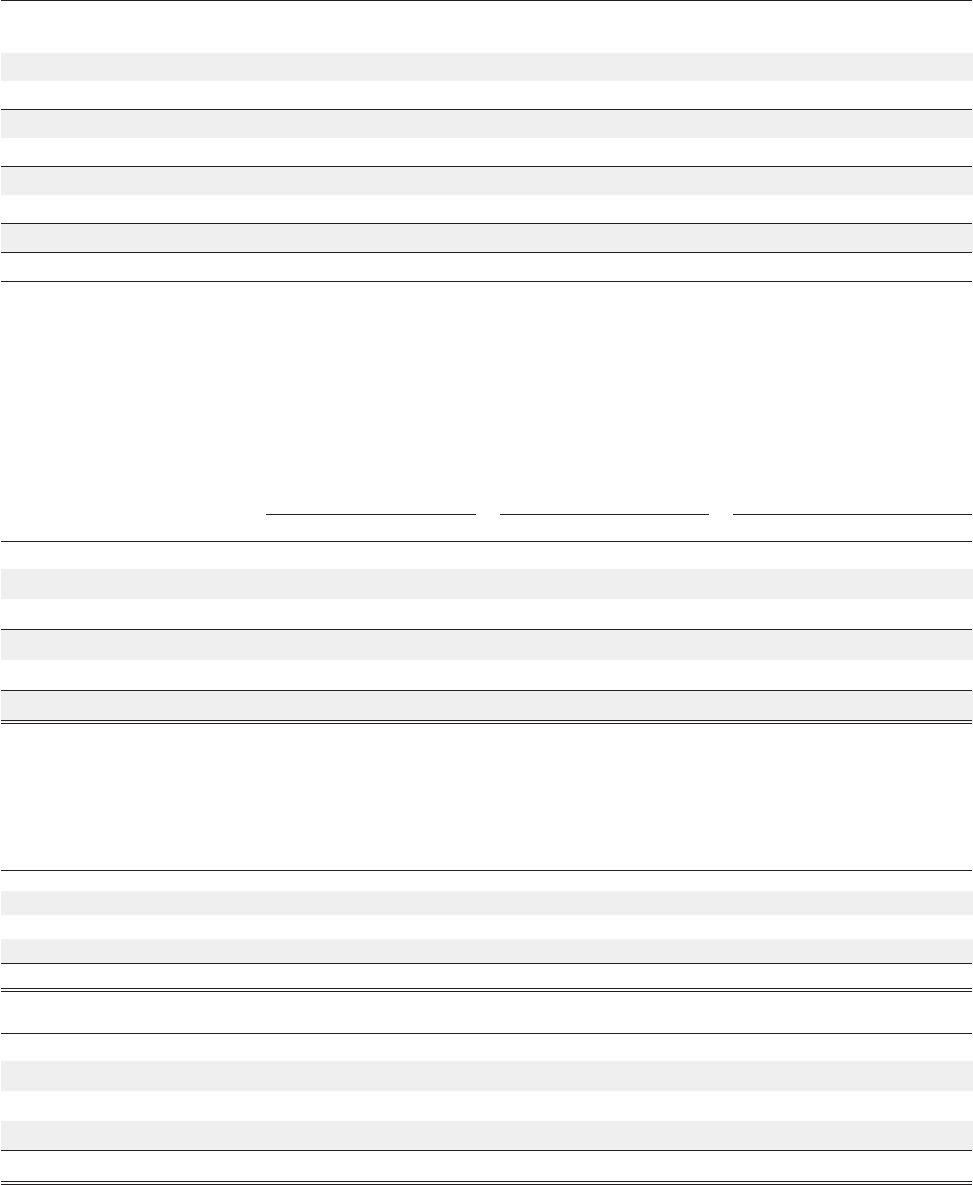
Depreciation
and Amortization Capital Expenditures
(1)
Total Assets
2014 2013 2012 2014 2013 2012 2014 2013 2012
(in millions)
Athletic Stores $ 119 $ 112 $ 96 $ 151 $ 163 $ 128 $2,499 $2,398 $2,310
Direct-to-Customers 799 955315 320 290
126 121 105 160 168 133 2,814 2,718 2,600
Corporate 13 12 13 30 38 30 763 769 767
Total Company $ 139 $ 133 $118 $ 190 $ 206 $ 163 $3,577 $3,487 $3,367
(1) Reflects cash capital expenditures for all years presented.
Sales and long-lived asset information by geographic area as of and for the fiscal years ended January 31, 2015,
February 1, 2014, and February 2, 2013 are presented in the following tables. Sales are attributed to the country
in which the sales originate. Long-lived assets reflect property and equipment.
2014 2013 2012
(in millions)
Sales
United States $4,976 $4,567 $4,495
International 2,175 1,938 1,687
Total sales $7,151 $6,505 $6,182
2014 2013 2012
(in millions)
Long-Lived Assets
United States $446 $394 $321
International 174 196 169
Total long-lived assets $620 $590 $490
47