Foot Locker 2014 Annual Report Download - page 36
Download and view the complete annual report
Please find page 36 of the 2014 Foot Locker annual report below. You can navigate through the pages in the report by either clicking on the pages listed below, or by using the keyword search tool below to find specific information within the annual report.-
 1
1 -
2
-
3
-
4
-
5
-
6
-
7
-
8
-
9
-
10
-
11
-
12
-
13
-
14
-
15
-
16
-
17
-
18
-
19
-
20
-
21
-
22
-
23
-
24
-
25
-
 26
26 -
 27
27 -
 28
28 -
 29
29 -
 30
30 -
 31
31 -
 32
32 -
 33
33 -
 34
34 -
 35
35 -
 36
36 -
 37
37 -
 38
38 -
 39
39 -
 40
40 -
 41
41 -
 42
42 -
 43
43 -
 44
44 -
 45
45 -
 46
46 -
47
-
48
-
49
-
50
-
51
-
52
-
53
-
54
-
55
-
56
-
57
-
58
-
59
-
60
-
61
-
62
-
63
-
64
-
65
-
66
-
67
-
68
-
69
-
70
-
71
-
72
-
73
-
74
-
75
-
76
-
77
-
78
-
79
-
80
-
81
-
82
-
83
-
84
-
85
-
86
-
87
-
88
-
89
-
90
-
91
-
92
-
93
-
94
-
95
-
96
-
97
-
98
-
99
-
100
-
101
-
102
-
103
-
104
-
105
-
106
-
107
-
108
-
109
-
110
-
111
-
112
 |
 |

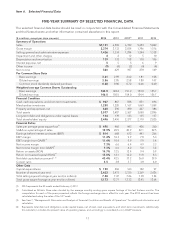
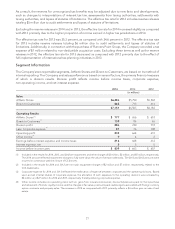
Item 6. Selected Financial Data
FIVE-YEAR SUMMARY OF SELECTED FINANCIAL DATA
The selected financial data below should be read in conjunction with the Consolidated Financial Statements
and the Notes thereto and other information contained elsewhere in this report.
($ in millions, except per share amounts) 2014 2013 2012
(1)
2011 2010
Summary of Operations
Sales $7,151 6,505 6,182 5,623 5,049
Gross margin 2,374 2,133 2,034 1,796 1,516
Selling, general and administrative expenses 1,426 1,334 1,294 1,244 1,138
Impairment and other charges 4212 5 10
Depreciation and amortization 139 133 118 110 106
Interest expense, net 5556 9
Other income (9) (4) (2) (4) (4)
Net income 520 429 397 278 169
Per Common Share Data
Basic earnings 3.61 2.89 2.62 1.81 1.08
Diluted earnings 3.56 2.85 2.58 1.80 1.07
Common stock dividends declared per share 0.88 0.80 0.72 0.66 0.60
Weighted-average Common Shares Outstanding
Basic earnings 143.9 148.4 151.2 153.0 155.7
Diluted earnings 146.0 150.5 154.0 154.4 156.7
Financial Condition
Cash, cash equivalents, and short-term investments $ 967 867 928 851 696
Merchandise inventories 1,250 1,220 1,167 1,069 1,059
Property and equipment, net 620 590 490 427 386
Total assets 3,577 3,487 3,367 3,050 2,896
Long-term debt and obligations under capital leases 134 139 133 135 137
Total shareholders’ equity 2,496 2,496 2,377 2,110 2,025
Financial Ratios
Sales per average gross square foot(2) $ 490 460 443 406 360
SG&A as a percentage of sales 19.9% 20.5 20.9 22.1 22.5
Earnings before interest and taxes (EBIT) $ 814 668 612 441 266
EBIT margin 11.4% 10.3 9.9 7.8 5.3
EBIT margin (non-GAAP)(3) 11.4% 10.4 9.9 7.9 5.4
Net income margin 7.3% 6.6 6.4 4.9 3.3
Net income margin (non-GAAP)(3) 7.3% 6.6 6.2 5.0 3.4
Return on assets (ROA) 14.7% 12.5 12.4 9.4 5.9
Return on invested capital (ROIC)(3) 15.0% 14.1 14.2 11.8 8.3
Net debt capitalization percent(3), (4) 43.4% 42.5 37.2 36.0 39.0
Current ratio 3.5 3.8 3.7 3.8 4.0
Other Data
Capital expenditures $ 190 206 163 152 97
Number of stores at year end 3,423 3,473 3,335 3,369 3,426
Total selling square footage at year end (in millions) 7.48 7.47 7.26 7.38 7.54
Total gross square footage at year end (in millions) 12.73 12.71 12.32 12.45 12.64
(1) 2012 represents the 53 weeks ended February 2, 2013.
(2) Calculated as Athletic Store sales divided by the average monthly ending gross square footage of the last thirteen months. The
computation for each of the years presented reflects the foreign exchange rate in affect for such year. The 2012 amount has been
calculated excluding the sales of the 53
rd
week.
(3) See Item 7, ‘‘Management’s Discussion and Analysis of Financial Condition and Results of Operations’’ for additional information and
calculation.
(4) Represents total debt and obligations under capital leases, net of cash, cash equivalents, and short-term investments. Additionally,
this calculation includes the present value of operating leases, and accordingly is considered a non-GAAP measure.
13