Foot Locker 2014 Annual Report Download - page 78
Download and view the complete annual report
Please find page 78 of the 2014 Foot Locker annual report below. You can navigate through the pages in the report by either clicking on the pages listed below, or by using the keyword search tool below to find specific information within the annual report.-
 1
1 -
2
-
3
-
4
-
5
-
6
-
7
-
8
-
9
-
10
-
11
-
12
-
13
-
14
-
15
-
16
-
17
-
18
-
19
-
20
-
21
-
22
-
23
-
24
-
25
-
26
-
27
-
28
-
29
-
30
-
31
-
32
-
33
-
34
-
35
-
36
-
37
-
38
-
39
-
40
-
41
-
42
-
43
-
44
-
45
-
46
-
47
-
48
-
49
-
50
-
51
-
52
-
53
-
54
-
55
-
56
-
57
-
58
-
59
-
60
-
61
-
62
-
63
-
64
-
65
-
66
-
67
-
 68
68 -
 69
69 -
 70
70 -
 71
71 -
 72
72 -
 73
73 -
 74
74 -
 75
75 -
 76
76 -
 77
77 -
 78
78 -
 79
79 -
 80
80 -
 81
81 -
 82
82 -
 83
83 -
 84
84 -
 85
85 -
 86
86 -
 87
87 -
 88
88 -
89
-
90
-
91
-
92
-
93
-
94
-
95
-
96
-
97
-
98
-
99
-
100
-
101
-
102
-
103
-
104
-
105
-
106
-
107
-
108
-
109
-
110
-
111
-
112
 |
 |

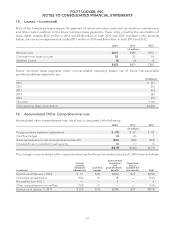
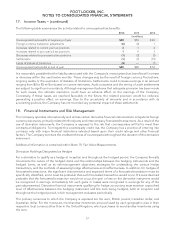
FOOT LOCKER, INC.
NOTES TO CONSOLIDATED FINANCIAL STATEMENTS
17. Income Taxes − (continued)
A reconciliation of the significant differences between the federal statutory income tax rate and the effective
income tax rate on pre-tax income is as follows:
2014 2013 2012
Federal statutory income tax rate 35.0% 35.0% 35.0%
State and local income taxes, net of federal tax benefit 3.2 3.5 3.2
International income taxed at varying rates (1.9) (1.6) (0.4)
Foreign tax credits (2.5) (2.5) (1.8)
Domestic/foreign tax settlements (0.6) (1.1) (2.2)
Federal tax credits (0.2) (0.2) (0.2)
Other, net 2.7 2.2 1.0
Effective income tax rate 35.7% 35.3% 34.6%
Deferred income taxes are provided for the effects of temporary differences between the amounts of assets
and liabilities recognized for financial reporting purposes and the amounts recognized for income tax purposes.
Items that give rise to significant portions of the Company’s deferred tax assets and deferred tax liabilities are
as follows:
2014 2013
(in millions)
Deferred tax assets:
Tax loss/credit carryforwards and capital loss $9 $12
Employee benefits 65 55
Property and equipment 137 147
Straight-line rent 33 30
Goodwill and other intangible assets —6
Other 38 33
Total deferred tax assets 282 283
Valuation allowance (6) (6)
Total deferred tax assets, net $276 $277
Deferred tax liabilities:
Merchandise inventories 96 85
Goodwill and other intangible assets 17 —
Other 111
Total deferred tax liabilities $114 $96
Net deferred tax asset $162 $181
Balance Sheet caption reported in:
Deferred taxes $221 $241
Other current assets 34
Accrued and other current liabilities (48) (46)
Other liabilities (14) (18)
$162 $181
55