Foot Locker 2014 Annual Report Download - page 46
Download and view the complete annual report
Please find page 46 of the 2014 Foot Locker annual report below. You can navigate through the pages in the report by either clicking on the pages listed below, or by using the keyword search tool below to find specific information within the annual report.-
 1
1 -
2
-
3
-
4
-
5
-
6
-
7
-
8
-
9
-
10
-
11
-
12
-
13
-
14
-
15
-
16
-
17
-
18
-
19
-
20
-
21
-
22
-
23
-
24
-
25
-
26
-
27
-
28
-
29
-
30
-
31
-
32
-
33
-
34
-
35
-
 36
36 -
 37
37 -
 38
38 -
 39
39 -
 40
40 -
 41
41 -
 42
42 -
 43
43 -
 44
44 -
 45
45 -
 46
46 -
 47
47 -
 48
48 -
 49
49 -
 50
50 -
 51
51 -
 52
52 -
 53
53 -
 54
54 -
 55
55 -
 56
56 -
57
-
58
-
59
-
60
-
61
-
62
-
63
-
64
-
65
-
66
-
67
-
68
-
69
-
70
-
71
-
72
-
73
-
74
-
75
-
76
-
77
-
78
-
79
-
80
-
81
-
82
-
83
-
84
-
85
-
86
-
87
-
88
-
89
-
90
-
91
-
92
-
93
-
94
-
95
-
96
-
97
-
98
-
99
-
100
-
101
-
102
-
103
-
104
-
105
-
106
-
107
-
108
-
109
-
110
-
111
-
112
 |
 |

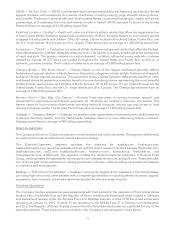
Additionally, the 2013 results reflect the reallocation of corporate expense to this segment. Excluding these
items, division profit margin for 2013 would have been essentially unchanged.
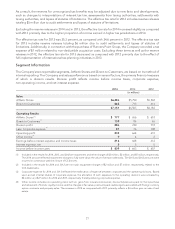
Direct-to-Customers
2014 2013 2012
(in millions)
Sales $ 865 $ 715 $ 614
$ Change $ 150 $ 101
% Change 21% 16%
Division profit $ 109 $84 $65
Division profit margin 12.6% 11.7% 10.6%
2014 compared with 2013
Comparable sales increased 17.8 percent from the prior year, led by basketball and running footwear. The
Direct-to-Customers segment includes $18 million of incremental sales related to the e-commerce division of
Runners Point Group, which the Company acquired during the second quarter of 2013. Excluding these sales,
the increase was primarily a result of continued strong sales performance related to the Company’s
store-banner websites both in the U.S. and in Europe, as well as increased Eastbay sales. Of the total increase,
sales from our U.S. store-banner websites comprised the majority of the increase, reflecting the continued
success of several initiatives, including improving the connectivity of the store banners to the e-commerce sites,
enhancements to the mobile e-commerce sites, investments in technology to improve the shopping
experience, and investments in making the sites more engaging. These increases were offset, in part, by a
decline in the CCS business, which was transitioned to the Eastbay banner during the third quarter of 2014.
Division profit increased by $25 million as compared to 2013, representing a division profit margin improvement
of 90 basis points. The 2014 results include a $2 million impairment charge related to the CCS business which
was triggered by the Company’s decision to transition the skate business to the Eastbay banner. Gross margin
was negatively affected by the liquidation of the CCS merchandise and the effects of providing additional free
shipping offers. Notwithstanding this, the increase in division profit was the result of strong flow-through of
sales to profit and good expense management.
2013 compared with 2012
Comparable sales increased 14.8 percent from the prior year. The Direct-to-Customers segment included
$18 million of sales related to the e-commerce division of Runners Point Group. Excluding these sales, the
increase was primarily a result of continued strong sales performance related to the Company’s store-banner
websites, as well as increased Eastbay sales. Of the total increase, sales from our store-banner websites
comprised approximately three quarters of the increase reflecting success of several e-commerce initiatives.
These increases were offset, in part, by a further decline in the CCS business.
The Direct-to-Customers business generated division profit of $84 million in 2013, as compared with $65 million
in 2012. The 2013 results reflect the reallocation of corporate expense. Excluding this change, division profit
margin would have been 12.3 percent. During 2012, an impairment charge of $7 million was recorded to write
down CCS intangible assets. Excluding these items, division profit increased by $17 million. The effect of the
Runners Point Group acquisition was not significant to this segment’s 2013 division profit.
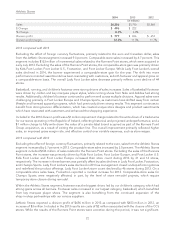
Corporate Expense
2014 2013 2012
(in millions)
Corporate expense $81 $ 76 $108
$ Change $5 $(32)
Corporate expense consists of unallocated general and administrative expenses as well as depreciation and
amortization related to the Company’s corporate headquarters, centrally managed departments, unallocated
23