Foot Locker 2014 Annual Report Download - page 43
Download and view the complete annual report
Please find page 43 of the 2014 Foot Locker annual report below. You can navigate through the pages in the report by either clicking on the pages listed below, or by using the keyword search tool below to find specific information within the annual report.-
 1
1 -
2
-
3
-
4
-
5
-
6
-
7
-
8
-
9
-
10
-
11
-
12
-
13
-
14
-
15
-
16
-
17
-
18
-
19
-
20
-
21
-
22
-
23
-
24
-
25
-
26
-
27
-
28
-
29
-
30
-
31
-
32
-
 33
33 -
 34
34 -
 35
35 -
 36
36 -
 37
37 -
 38
38 -
 39
39 -
 40
40 -
 41
41 -
 42
42 -
 43
43 -
 44
44 -
 45
45 -
 46
46 -
 47
47 -
 48
48 -
 49
49 -
 50
50 -
 51
51 -
 52
52 -
 53
53 -
54
-
55
-
56
-
57
-
58
-
59
-
60
-
61
-
62
-
63
-
64
-
65
-
66
-
67
-
68
-
69
-
70
-
71
-
72
-
73
-
74
-
75
-
76
-
77
-
78
-
79
-
80
-
81
-
82
-
83
-
84
-
85
-
86
-
87
-
88
-
89
-
90
-
91
-
92
-
93
-
94
-
95
-
96
-
97
-
98
-
99
-
100
-
101
-
102
-
103
-
104
-
105
-
106
-
107
-
108
-
109
-
110
-
111
-
112
 |
 |

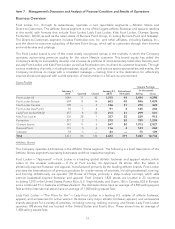
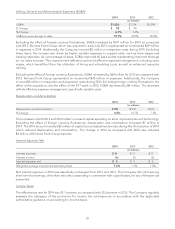
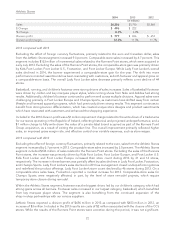
Selling, General and Administrative Expenses (SG&A)
2014 2013 2012
(in millions)
SG&A $1,426 $1,334 $1,294
$ Change $92 $40
% Change 6.9% 3.1%
SG&A as a percentage of sales 19.9% 20.5% 20.9%
Excluding the effect of foreign currency fluctuations, SG&A increased by $101 million for 2014 as compared
with 2013. Runners Point Group, which was acquired in early July 2013, represented an incremental $39 million
in expenses in 2014. Additionally, the Company incurred $2 million in integration costs during 2014. Excluding
these items, the increase was driven by higher variable expenses to support sales, such as store wages and
banking expenses. As a percentage of sales, SG&A improved 60 basis points representing improved leverage
on our sales increase. This improvement reflected continued effective expense management, including store
wages, which benefitted from the utilization of hiring and scheduling tools, as well as enhanced associate
training.
Excluding the effect of foreign currency fluctuations, SG&A increased by $34 million for 2013 as compared with
2012. Runners Point Group represented an incremental $45 million in expenses. Additionally, the Company
incurred $6 million in integration and acquisition costs during 2013. Excluding foreign currency fluctuations, the
effect of the acquisition, and the effect of the 53
rd
week in 2012, SG&A decreased by $4 million. The decrease
reflects effective expense management, specifically variable costs.
Depreciation and Amortization
2014 2013 2012
(in millions)
Depreciation and Amortization $139 $ 133 $118
% Change 4.5% 12.7% 7.3%
The increases in both 2014 and 2013 reflect increased capital spending on store improvements and technology.
Excluding the effect of foreign currency fluctuations, depreciation and amortization increased $7 million in
2014. The 2014 amount included $2 million of capital accrual adjustments made during the third quarter of 2014
which reduced depreciation and amortization. The change in 2013 as compared with 2012 also included
$6 million of Runners Point Group expense.
Interest Expense, Net
2014 2013 2012
(in millions)
Interest expense $11 $11 $11
Interest income (6) (6) (6)
Interest expense, net $5 $5 $5
Weighted-average interest rate (excluding fees) 7.2% 7.1% 7.6%
Net interest expense in 2014 was essentially unchanged from 2013 and 2012. The Company did not have any
short-term borrowings, other than amounts outstanding in connection with capital leases, for any of the periods
presented.
Income Taxes
The effective tax rate for 2014 was 35.7 percent, as compared with 35.3 percent in 2013. The Company regularly
assesses the adequacy of the provisions for income tax contingencies in accordance with the applicable
authoritative guidance on accounting for income taxes.
20