Chevron 2009 Annual Report Download - page 86
Download and view the complete annual report
Please find page 86 of the 2009 Chevron annual report below. You can navigate through the pages in the report by either clicking on the pages listed below, or by using the keyword search tool below to find specific information within the annual report.-
 1
1 -
2
-
3
-
4
-
5
-
6
-
7
-
8
-
9
-
10
-
11
-
12
-
13
-
14
-
15
-
16
-
17
-
18
-
19
-
20
-
21
-
22
-
23
-
24
-
25
-
26
-
27
-
28
-
29
-
30
-
31
-
32
-
33
-
34
-
35
-
36
-
37
-
38
-
39
-
40
-
41
-
42
-
43
-
44
-
45
-
46
-
47
-
48
-
49
-
50
-
51
-
52
-
53
-
54
-
55
-
56
-
57
-
58
-
59
-
60
-
61
-
62
-
63
-
64
-
65
-
66
-
67
-
68
-
69
-
70
-
71
-
72
-
73
-
74
-
75
-
 76
76 -
 77
77 -
 78
78 -
 79
79 -
 80
80 -
 81
81 -
 82
82 -
 83
83 -
 84
84 -
 85
85 -
 86
86 -
 87
87 -
 88
88 -
 89
89 -
 90
90 -
 91
91 -
 92
92
 |
 |

FS-PB
84 Chevron Corporation 2009 Annual Report
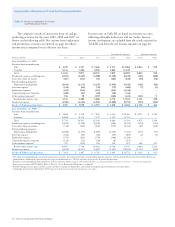
Supplemental Information on Oil and Gas Producing Activities
The changes in present values between years, which can
be significant, reflect changes in estimated proved-reserve
quantities and prices and assumptions used in forecasting
Tota l
Consolidated
and Affiliated
Millions of dollars Consolidated Companies Affiliated Companies Companies
Present Value at January 1, 2007 $ 65,820 $ 26,535 $ 92,355
Sales and transfers of oil and gas produced net of production costs (34,957) (4,084) (39,041)
Development costs incurred 10,468 889 11,357
Purchases of reserves 780 7,711 8,491
Sales of reserves (425) (7,767) (8,192)
Extensions, discoveries and improved recovery less related costs 3,664 – 3,664
Revisions of previous quantity estimates (7,801) (1,333) (9,134)
Net changes in prices, development and production costs 74,900 23,616 98,516
Accretion of discount 12,196 3,745 15,941
Net change in income tax (27,596) (7,554) (35,150)
Net change for the year 31,229 15,223 46,452
Present Value at December 31, 2007 $ 97,049 $ 41,758 $ 138,807
Sales and transfers of oil and gas produced net of production costs (43,906) (5,750) (49,656)
Development costs incurred 13,682 763 14,445
Purchases of reserves 233 – 233
Sales of reserves (542) – (542)
Extensions, discoveries and improved recovery less related costs 646 83 729
Revisions of previous quantity estimates 37,853 3,718 41,571
Net changes in prices, development and production costs (169,046) (51,696) (220,742)
Accretion of discount 17,458 5,976 23,434
Net change in income tax 72,234 14,889 87,123
Net change for 2008 (71,388) (32,017) (103,405)
Present Value at December 31, 2008 $ 25,661 $ 9,741 $ 35,402
Sales and transfers of oil and gas produced net of production costs (27,559) (4,209) (31,768)
Development costs incurred 10,791 335 11,126
Purchases of reserves – – –
Sales of reserves (285) – (285)
Extensions, discoveries and improved recovery less related costs 3,438 697 4,135
Revisions of previous quantity estimates 3,230 (4,343) (1,113)
Net changes in prices, development and production costs 51,528 30,915 82,443
Accretion of discount 4,282 1,412 5,694
Net change in income tax (20,810) (7,312) (28,122)
Net change for 2009 24,615 17,495 42,110
Present Value at December 31, 2009 $ 50,276 $ 27,236 $ 77,512
production volumes and costs. Changes in the timing of
production are included with “Revisions of previous
quantity estimates.”
Table VII Changes in the Standardized Measure of Discounted
Future Net Cash Flows From Proved Reserves