Chevron 2009 Annual Report Download - page 48
Download and view the complete annual report
Please find page 48 of the 2009 Chevron annual report below. You can navigate through the pages in the report by either clicking on the pages listed below, or by using the keyword search tool below to find specific information within the annual report.-
 1
1 -
2
-
3
-
4
-
5
-
6
-
7
-
8
-
9
-
10
-
11
-
12
-
13
-
14
-
15
-
16
-
17
-
18
-
19
-
20
-
21
-
22
-
23
-
24
-
25
-
26
-
27
-
28
-
29
-
30
-
31
-
32
-
33
-
34
-
35
-
36
-
37
-
 38
38 -
 39
39 -
 40
40 -
 41
41 -
 42
42 -
 43
43 -
 44
44 -
 45
45 -
 46
46 -
 47
47 -
 48
48 -
 49
49 -
 50
50 -
 51
51 -
 52
52 -
 53
53 -
 54
54 -
 55
55 -
 56
56 -
 57
57 -
 58
58 -
59
-
60
-
61
-
62
-
63
-
64
-
65
-
66
-
67
-
68
-
69
-
70
-
71
-
72
-
73
-
74
-
75
-
76
-
77
-
78
-
79
-
80
-
81
-
82
-
83
-
84
-
85
-
86
-
87
-
88
-
89
-
90
-
91
-
92
 |
 |

46 Chevron Corporation 2009 Annual Report
FS-PB
Note 9 Fair Value Measurements – Continued
Assets and Liabilities Not Required to Be Measured at Fair
Value The company holds cash equivalents in U.S. and non-
U.S. portfolios. The instruments held are primarily time
deposits and money market funds. The fair values reflect the
cash that would have been received or paid if the instruments
were settled at year-end. Cash equivalents had carrying/fair
values of $6,396 and $7,058 at December 31, 2009 and
2008, respectively, and average maturities under 90 days. The
balance at December 31, 2009, includes $123 of investments
for restricted funds related to an international upstream
development project and Pascagoula Refinery projects, which
are included in “Deferred charges and other assets” on the
Consolidated Balance Sheet. Long-term debt of $5,705 and
$1,221 had estimated fair values of $6,229 and $1,414 at
December 31, 2009 and 2008, respectively.
Fair values of other financial instruments at the end of
2009 and 2008 were not material.
Note 10
Financial and Derivative Instruments
Derivative Commodity Instruments Chevron is exposed
to market risks related to price volatility of crude oil, refined
products, natural gas, natural gas liquids, liquefied natural gas
and refinery feedstocks.
The company uses derivative commodity instruments to
manage these exposures on a portion of its activity, including
firm commitments and anticipated transactions for the pur-
chase, sale and storage of crude oil, refined products, natural
gas, natural gas liquids and feedstock for company refineries.
From time to time, the company also uses derivative commod-
ity instruments for limited trading purposes.
The company’s derivative commodity instruments prin-
cipally include crude-oil, natural-gas and refined-product
futures, swaps, options and forward contracts. None of the
company’s derivative instruments is designated as a hedging
instrument, although certain of the company’s affiliates make
such designation. The company’s derivatives are not material
to the company’s financial position, results of operations or
liquidity. The company believes it has no material market or
credit risks to its operations, financial position or liquidity as a
result of its commodities and other derivatives activities.
The company uses Inter national Swaps and Derivatives
Association agreements to govern derivative contracts with cer-
tain counterparties to mitigate credit risk. Depending on the
nature of the derivative transactions, bilateral collateral arrange-
ments may also be required. When the company is engaged in
more than one outstanding derivative transaction with the same
counterparty and also has a legally enforceable netting agree-
ment with that counterparty, the net mark-to-market exposure
represents the netting of the positive and negative exposures
with that counterparty and is a reasonable measure of the
company’s credit risk exposure. The company also uses other
netting agreements with certain counterparties with which it
conducts significant transactions to mitigate credit risk.
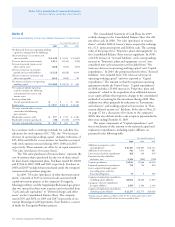
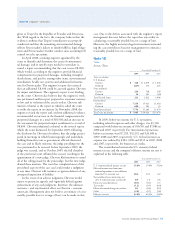
The fair-value hierarchy for nonrecurring assets and liabilities measured at fair value during 2009 is presented in the following table.
Assets and Liabilities Measured at Fair Value on a Non-recurring Basis
Prices in Active Other Loss (Before Tax)
Year Ended Markets for Observable Unobservable Year Ended
December 31 Identical Assets Inputs Inputs December 31
2009 (Level 1) (Level 2) (Level 3) 2009
Properties, plant and equipment, net (held and used) $ 490 $ – $ – $ 490 $ 459
Properties, plant and equipment, net (held for sale) 68 – 68 – 92
Total Nonrecurring Assets at Fair Value $ 558 $ – $ 68 $ 490 $ 551
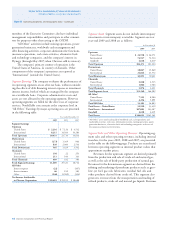
Derivative instruments measured at fair value at December 31, 2009, and December 31, 2008, and their classification on the
Consolidated Balance Sheet and Consolidated Statement of Income are as follows:
Consolidated Balance Sheet: Fair Value of Derivatives Not Designated as Hedging Instruments
Asset Derivatives – Fair Value Liability Derivatives – Fair Value
Type of Balance Sheet At December 31 At December 31 Balance Sheet At December 31 At December 31
Derivative Contract Classification 2009 2008 Classification 2009 2008
Foreign Exchange Accounts and notes
receivable, net $ –$ 11 Accrued liabilities $ – $ 89
Commodity Accounts and notes
receivable, net 99 764 Accounts payable 73 344
Commodity Long-term Deferred credits and
receivables, net 28 30 other noncurrent obligations 28 83
$ 127 $ 805 $ 101 $ 516
Notes to the Consolidated Financial Statements
Millions of dollars, except per-share amounts