Chevron 2009 Annual Report Download - page 72
Download and view the complete annual report
Please find page 72 of the 2009 Chevron annual report below. You can navigate through the pages in the report by either clicking on the pages listed below, or by using the keyword search tool below to find specific information within the annual report.-
 1
1 -
2
-
3
-
4
-
5
-
6
-
7
-
8
-
9
-
10
-
11
-
12
-
13
-
14
-
15
-
16
-
17
-
18
-
19
-
20
-
21
-
22
-
23
-
24
-
25
-
26
-
27
-
28
-
29
-
30
-
31
-
32
-
33
-
34
-
35
-
36
-
37
-
38
-
39
-
40
-
41
-
42
-
43
-
44
-
45
-
46
-
47
-
48
-
49
-
50
-
51
-
52
-
53
-
54
-
55
-
56
-
57
-
58
-
59
-
60
-
61
-
 62
62 -
 63
63 -
 64
64 -
 65
65 -
 66
66 -
 67
67 -
 68
68 -
 69
69 -
 70
70 -
 71
71 -
 72
72 -
 73
73 -
 74
74 -
 75
75 -
 76
76 -
 77
77 -
 78
78 -
 79
79 -
 80
80 -
 81
81 -
 82
82 -
83
-
84
-
85
-
86
-
87
-
88
-
89
-
90
-
91
-
92
 |
 |

70 Chevron Corporation 2009 Annual Report
FS-PB
70 Chevron Corporation 2009 Annual Report
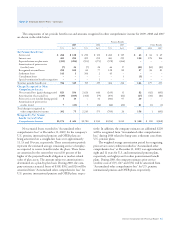
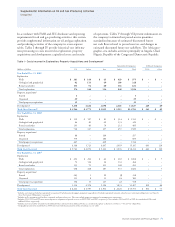
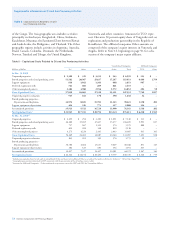
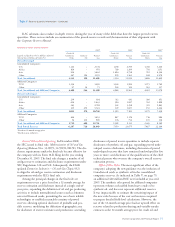
Five-Year Operating Summary
Unaudited
Worldwide – Includes Equity in Affiliates
Thousands of barrels per day, except natural gas data,
which is millions of cubic feet per day 2009 2008 2007 2006 2005
United States
Gross production of crude oil and natural gas liquids1 523 459 507 510 499
Net production of crude oil and natural gas liquids1 484 421 460 462 455
Gross production of natural gas 1,611 1,740 1,983 2,115 1,860
Net production of natural gas2 1,399 1,501 1,699 1,810 1,634
Net oil-equivalent production 717 671 743 763 727
Refinery input 899 891 812 939 845
Sales of refined products3 1,403 1,413 1,457 1,494 1,473
Sales of natural gas liquids 161 159 160 124 151
Total sales of petroleum products 1,564 1,572 1,617 1,618 1,624
Sales of natural gas 5,901 7,226 7,624 7,051 5,449
International
Gross production of crude oil and natural gas liquids1 1,857 1,751 1,751 1,739 1,676
Net production of crude oil and natural gas liquids1 1,362 1,228 1,296 1,270 1,214
Other produced volumes 26 27 27 109 143
Gross production of natural gas 4,519 4,525 4,099 3,767 2,726
Net production of natural gas2 3,590 3,624 3,320 3,146 2,599
Net oil-equivalent production 1,987 1,859 1,876 1,904 1,790
Refinery input 979 967 1,021 1,050 1,038
Sales of refined products3 1,851 2,016 2,027 2,127 2,252
Sales of natural gas liquids 111 114 118 102 120
Total sales of petroleum products 1,962 2,130 2,145 2,229 2,372
Sales of natural gas 4,062 4,215 3,792 3,478 2,450
Total Worldwide
Gross production of crude oil and natural gas liquids1 2,380 2,210 2,258 2,249 2,175
Net production of crude oil and natural gas liquids1 1,846 1,649 1,756 1,732 1,669
Other produced volumes 26 27 27 109 143
Gross production of natural gas 6,130 6,265 6,082 5,882 4,586
Net production of natural gas2 4,989 5,125 5,019 4,956 4,233
Net oil-equivalent production 2,704 2,530 2,619 2,667 2,517
Refinery input 1,878 1,858 1,833 1,989 1,883
Sales of refined products3 3,254 3,429 3,484 3,621 3,725
Sales of natural gas liquids 272 273 278 226 271
Total sales of petroleum products 3,526 3,702 3,762 3,847 3,996
Sales of natural gas 9,963 11,441 11,416 10,529 7,899
Worldwide – Excludes Equity in Affiliates
Number of wells completed (net)4
Oil and gas 1,265 1,648 1,633 1,575 1,365
Dry 14 12 30 32 26
Productive oil and gas wells (net)4 50,817 51,291 51,528 50,695 49,508
1 Gross production represents the company’s share of total production before deducting lessors’ royalties and government’s agreed-upon share of production under a production-sharing
contract. Net production is gross production minus royalties paid to lessors and the government.
2 Includes natural gas consumed in operations:
United States 58 70 65 56 48
International 463 450 433 419 356
Total 521 520 498 475 404
3 Includes volumes for buy/sell contracts (MBPD):
United States – – – 26 88
International – – – 24 129
4 Net wells include wholly owned and the sum of fractional interests in partially owned wells.