Chevron 2009 Annual Report Download - page 7
Download and view the complete annual report
Please find page 7 of the 2009 Chevron annual report below. You can navigate through the pages in the report by either clicking on the pages listed below, or by using the keyword search tool below to find specific information within the annual report.-
 1
1 -
 2
2 -
 3
3 -
 4
4 -
 5
5 -
 6
6 -
 7
7 -
 8
8 -
 9
9 -
 10
10 -
 11
11 -
 12
12 -
 13
13 -
 14
14 -
 15
15 -
 16
16 -
 17
17 -
 18
18 -
19
-
20
-
21
-
22
-
23
-
24
-
25
-
26
-
27
-
28
-
29
-
30
-
31
-
32
-
33
-
34
-
35
-
36
-
37
-
38
-
39
-
40
-
41
-
42
-
43
-
44
-
45
-
46
-
47
-
48
-
49
-
50
-
51
-
52
-
53
-
54
-
55
-
56
-
57
-
58
-
59
-
60
-
61
-
62
-
63
-
64
-
65
-
66
-
67
-
68
-
69
-
70
-
71
-
72
-
73
-
74
-
75
-
76
-
77
-
78
-
79
-
80
-
81
-
82
-
83
-
84
-
85
-
86
-
87
-
88
-
89
-
90
-
91
-
92
 |
 |
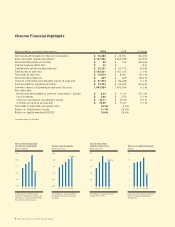
Chevron Operating Highlights1
2009 2008 % Change
Net production of crude oil and natural gas liquids (Thousands of barrels per day) 1,846 1,649 11.9 %
Net production of natural gas (Millions of cubic feet per day) 4,989 5,125 (2.7) %
Net production of oil sands (Thousands of barrels per day) 26 27 (3.7) %
Total net oil-equivalent production (Thousands of oil-equivalent barrels per day) 2,704 2,530 6.9 %
Refinery input (Thousands of barrels per day) 1,878 1,858 1.1 %
Sales of refined products (Thousands of barrels per day) 3,254 3,429 (5.1) %
Net proved reserves of liquids2,3 (Millions of barrels)
— C onsolidated companies 4,610 4,735 (2.6) %
— A ffiliated companies 2,363 2,615 (9.6) %
Net proved reserves of natural gas3 (Billions of cubic feet)
— C onsolidated companies 22,153 19,022 16.5 %
— A ffiliated companies 3,896 4,053 (3.9) %
Net proved oil-equivalent reserves2,3 (Millions of barrels)
— C onsolidated companies 8,303 7,905 5.0 %
— A ffiliated companies 3,012 3,291 (8.5) %
Number of employees at year-end4 59,963 61,604 (2.7) %
1 Includes equity in affiliates, except number of employees
2 L iquids consist of crude oil, condensate, natural gas liquids and
synthetic oil. For 2009, includes 460 million barrels of synthetic
oil from Canadian oil sands. None are included for 2008.
3 A t the end of the year
4 E xcludes service station personnel
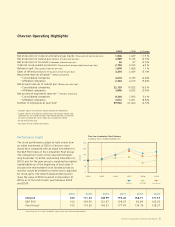
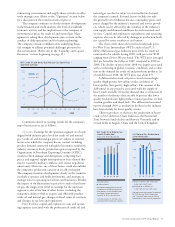
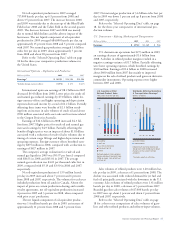
Performance Graph
The stock performance graph at right shows how
an initial investment of $100 in Chevron stock
would have compared with an equal investment in
the S&P 500 Index or the Competitor Peer Group.
The comparison covers a five-year period begin -
ning December 31, 2004, and ending December 31,
2009, and for the peer group is weighted by market
capitalization as of the beginning of each year. It
includes the reinvestment of all dividends that an
investor would be entitled to receive and is adjusted
for stock splits. The interim measurement points
show the value of $100 invested on December 31,
2004, as of the end of each year between 2005
and 2009.
*Peer Group: BP p.l.c.-ADS, ExxonMobil, Royal Dutch Shell-ADR and ConocoPhillips
Chevron
S&P 500
Peer Group*
2004
100
100
100
2005
111.34
104.90
114.25
2006
148.99
121.47
143.51
2007
194.40
128.07
177.99
2009
171.57
102.03
138.37
Five-Year Cumulative Total Returns
(Calendar years ended December 31)
250
150
200
100
0
50
2004
2005 2006 2007 2008 2009
Dollars
Chevron S&P 500 Peer Group*
2008
158.71
80.69
134.76
Chevron Corporation 2009 Annual Report 5
Narrative.cg_R6.indd 5 3/28/10 8:56 AM