Chevron 2009 Annual Report Download - page 20
Download and view the complete annual report
Please find page 20 of the 2009 Chevron annual report below. You can navigate through the pages in the report by either clicking on the pages listed below, or by using the keyword search tool below to find specific information within the annual report.-
 1
1 -
2
-
3
-
4
-
5
-
6
-
7
-
8
-
9
-
 10
10 -
 11
11 -
 12
12 -
 13
13 -
 14
14 -
 15
15 -
 16
16 -
 17
17 -
 18
18 -
 19
19 -
 20
20 -
 21
21 -
 22
22 -
 23
23 -
 24
24 -
 25
25 -
 26
26 -
 27
27 -
 28
28 -
 29
29 -
 30
30 -
31
-
32
-
33
-
34
-
35
-
36
-
37
-
38
-
39
-
40
-
41
-
42
-
43
-
44
-
45
-
46
-
47
-
48
-
49
-
50
-
51
-
52
-
53
-
54
-
55
-
56
-
57
-
58
-
59
-
60
-
61
-
62
-
63
-
64
-
65
-
66
-
67
-
68
-
69
-
70
-
71
-
72
-
73
-
74
-
75
-
76
-
77
-
78
-
79
-
80
-
81
-
82
-
83
-
84
-
85
-
86
-
87
-
88
-
89
-
90
-
91
-
92
 |
 |

Management’s Discussion and Analysis of
Financial Condition and Results of Operations
18 Chevron Corporation 2009 Annual Report
FS-PB
of the company’s Benelux refining and marketing businesses
and a decline in import volumes in the United Kingdom.
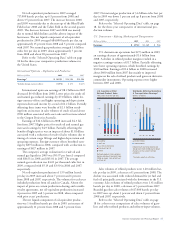
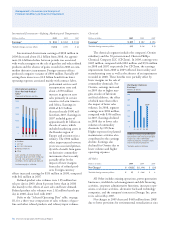
Millions of dollars 2009 2008 2007
Interest and debt expense $ 28 $ – $ 166
Interest and debt expense increased in 2009 due to
an increase in long-term debt. Interest and debt expense
decreased in 2008 because all interest-related amounts were
being capitalized.
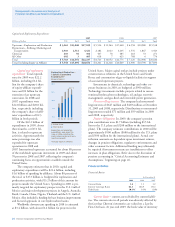
Millions of dollars 2009 2008 2007
Income tax expense $ 7,965 $ 19,026 $ 13,479
Effective income tax rates were 43 percent in 2009,
44 percent in 2008 and 42 percent in 2007. The rate was
lower in 2009 than in 2008 mainly due the effect in 2009 of
deferred tax benefits and relatively low tax rates on asset sales,
both related to an international upstream project. In addi-
tion, a greater proportion of before-tax income was earned
in 2009 by equity affiliates than in 2008. (Equity-affiliate
income is reported as a single amount on an after-tax basis on
the Consolidated Statement of Income.) Partially offsetting
these items was the effect of a greater proportion of income
earned in 2009 in tax jurisdictions with higher tax rates. The
rate was higher in 2008 compared with 2007 primarily due
to a greater proportion of income earned in tax jurisdictions
with higher income tax rates. In addition, the 2007 period
included a relatively low effective tax rate on the sale of the
company’s investment in Dynegy common stock and the sale
of downstream assets in Europe. Refer also to the discussion
of income taxes in Note 15 beginning on page 53.
Selected Operating Data1,2
2009 2008 2007
U.S. Upstream
Net Crude Oil and Natural Gas
Liquids Production (MBPD) 484 421 460
Net Natural Gas Production (MMCFPD)3 1,399 1,501 1,699
Net Oil-Equivalent Production (MBOEPD) 717 671 743
Sales of Natural Gas (MMCFPD) 5,901 7,226 7,624
Sales of Natural Gas Liquids (MBPD) 17 15 25
Revenues From Net Production
Liquids ($/Bbl) $ 54.36 $ 88.43 $ 63.16
Natural Gas ($/MCF) $ 3.73 $ 7.90 $ 6.12
International Upstream
Net Crude Oil and Natural Gas
Liquids Production (MBPD) 1,362 1,228 1,296
Net Natural Gas Production (MMCFPD)3 3,590 3,624 3,320
Net Oil-Equivalent
Production (MBOEPD)4 1,987 1,859 1,876
Sales of Natural Gas (MMCFPD) 4,062 4,215 3,792
Sales of Natural Gas Liquids (MBPD) 23 17 22
Revenues From Liftings
Liquids ($/Bbl) $ 55.97 $ 86.51 $ 65.01
Natural Gas ($/MCF) $ 4.01 $ 5.19 $ 3.90
Worldwide Upstream
Net Oil-Equivalent Production
(MBOEPD)3,4
United States 717 671 743
International 1,987 1,859 1,876
Total 2,704 2,530 2,619
U.S. Downstream
Gasoline Sales (MBPD)5 720 692 728
Other Refined-Product Sales (MBPD) 683 721 729
Total Refined Product Sales (MBPD) 1,403 1,413 1,457
Sales of Natural Gas Liquids (MBPD) 144 144 135
Refinery Input (MBPD) 899 891 812
International Downstream
Gasoline Sales (MBPD)5 555 589 581
Other Refined-Product Sales (MBPD) 1,296 1,427 1,446
Total Refined Product Sales (MBPD)6 1,851 2,016 2,027
Sales of Natural Gas Liquids (MBPD) 88 97 96
Refinery Input (MBPD) 979 967 1,021
1 Includes company share of equity affiliates.
2 MBPD – thousands of barrels per day; MMCFPD – millions of cubic feet per day;
MBOEPD – thousands of barrels of oil-equivalents per day; Bbl – Barrel; MCF
= Thousands of cubic feet. Oil-equivalent gas (OEG) conversion ratio is 6,000
cubic feet of natural gas = 1 barrel of oil.
3 Includes natural gas consumed in operations (MMCFPD):
United States 58 70 65
International 463 450 433
4 Includes production from oil sands, Net (MBPD): 26 27 27
5 Includes branded and unbranded gasoline.
6 Includes sales of affiliates (MBPD): 516 512 492