Chevron 2009 Annual Report Download - page 16
Download and view the complete annual report
Please find page 16 of the 2009 Chevron annual report below. You can navigate through the pages in the report by either clicking on the pages listed below, or by using the keyword search tool below to find specific information within the annual report.-
 1
1 -
2
-
3
-
4
-
5
-
 6
6 -
 7
7 -
 8
8 -
 9
9 -
 10
10 -
 11
11 -
 12
12 -
 13
13 -
 14
14 -
 15
15 -
 16
16 -
 17
17 -
 18
18 -
 19
19 -
 20
20 -
 21
21 -
 22
22 -
 23
23 -
 24
24 -
 25
25 -
 26
26 -
27
-
28
-
29
-
30
-
31
-
32
-
33
-
34
-
35
-
36
-
37
-
38
-
39
-
40
-
41
-
42
-
43
-
44
-
45
-
46
-
47
-
48
-
49
-
50
-
51
-
52
-
53
-
54
-
55
-
56
-
57
-
58
-
59
-
60
-
61
-
62
-
63
-
64
-
65
-
66
-
67
-
68
-
69
-
70
-
71
-
72
-
73
-
74
-
75
-
76
-
77
-
78
-
79
-
80
-
81
-
82
-
83
-
84
-
85
-
86
-
87
-
88
-
89
-
90
-
91
-
92
 |
 |

Management’s Discussion and Analysis of
Financial Condition and Results of Operations
14 Chevron Corporation 2009 Annual Report
FS-PB
Venezuela In February 2010, a Chevron-led consortium
was named the operator of a heavy-oil project composed of
three blocks in the Orinoco Oil Belt of eastern Venezuela.
United States First oil was achieved at the 58 percent-
owned and operated Tahiti Field in the deepwater Gulf of
Mexico, reaching maximum total production of 135,000 bar-
rels of oil-equivalent per day. The company also discovered
crude oil at the Chevron-operated and 55 percent-owned
Buckskin prospect in the deepwater Gulf of Mexico. The first
appraisal well is scheduled to begin drilling in the second
quarter 2010.
Downstream
The company sold businesses during 2009 in Brazil, Haiti,
Nigeria, Benin, Cameroon, Republic of the Congo, Côte
d’Ivoire, Togo, Kenya, Uganda, India, Italy, Peru and Chile.
Other
Common Stock Dividends The quarterly common stock
dividend increased by 4.6 percent in July 2009, to $0.68 per
share. 2009 was the 22nd consecutive year that the company
increased its annual dividend payment.
Common Stock Repurchase Program The company did
not acquire any shares during 2009 under its $15 billion
repurchase program, which began in 2007 and expires in
September 2010. As of December 31, 2009, 119 million
common shares had been acquired under this program for
$10.1 billion.
Results of Operations
Major Operating Areas The following section presents the
results of operations for the company’s business segments –
upstream, downstream and chemicals – as well as for “all
other,” which includes mining, power generation businesses,
the various companies and departments that are managed at
the corporate level, and the company’s investment in Dynegy
prior to its sale in May 2007. Earnings are also presented for
the U.S. and international geographic areas of the upstream
and downstream business segments. (Refer to Note 11,
beginning on page 47, for a discussion of the company’s
“reportable segments,” as defined in accounting standards
for segment reporting (Accounting Standards Codification
(ASC) 280)). This section should also be read in conjunction
with the discussion in “Business Environment and Outlook”
on pages 10 through 13.
U.S. Upstream – Exploration and Production
Millions of dollars 2009 2008 2007
Earnings $ 2,216 $ 7,126 $ 4,532
U.S. upstream earnings of $2.2 billion in 2009 decreased
$4.9 billion from 2008. Lower prices for crude oil and
natural gas reduced earnings by about $5.2 billion between
periods, and gains on asset sales declined by approximately
$900 million. Partially offsetting these effects was a ben-
efit of about $1.3 billion resulting from an increase in net
oil-equivalent production. An approximate $600 million
benefit to income from lower operating expenses was more
than offset by higher depreciation expense. The benefit from
lower operating expenses was largely associated with absence
of charges for damages related to the 2008 hurricanes in the
Gulf of Mexico.
U.S. upstream earnings of $7.1 billion in 2008 increased
$2.6 billion from 2007. Higher average prices for crude oil
and natural gas increased earnings by $3.1 billion between
periods. Also contributing to the higher earnings were
gains of approximately $1 billion on asset sales, including
a $600 million gain on an asset-exchange transaction. Par-
tially offsetting these benefits were adverse effects of about
$1.6 billion associated with lower oil-equivalent production
and higher operating expenses, which included approximately
$400 million of expenses resulting from damage to facilities
in the Gulf of Mexico caused by hurricanes.
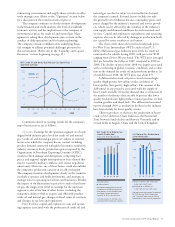
The company’s average realization for crude oil and
natural gas liquids in 2009 was $54.36 per barrel, compared
with $88.43 in 2008 and $63.16 in 2007. The average
natural-gas realization was $3.73 per thousand cubic feet
in 2009, compared with $7.90 and $6.12 in 2008 and
2 0 07, respectively.
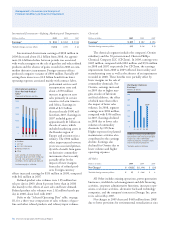
0
150 0
120 0
900
600
300
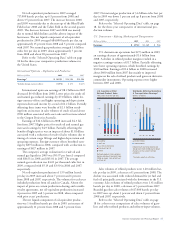
Exploration Expenses
Millions of dollars
United States
International
Exploration expenses increased
15 percent from 2008 due mainly
to higher well write-offs.
#016 – Exploration Expenses – v2
0605 07 08 09
$1,342
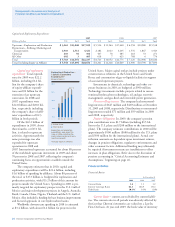
0.0
25.0
15.0
20.0
10.0
5.0
#017 – Worldwide Expl & Prod
Earnings – v2
Worldwide Exploration &
Production Earnings
Billions of dollars
Earnings decreased in 2009 on
lower average prices for crude oil
and natural gas.
United States
International
0605 07 08 09
$10.4