Chevron 2009 Annual Report Download - page 79
Download and view the complete annual report
Please find page 79 of the 2009 Chevron annual report below. You can navigate through the pages in the report by either clicking on the pages listed below, or by using the keyword search tool below to find specific information within the annual report.-
 1
1 -
2
-
3
-
4
-
5
-
6
-
7
-
8
-
9
-
10
-
11
-
12
-
13
-
14
-
15
-
16
-
17
-
18
-
19
-
20
-
21
-
22
-
23
-
24
-
25
-
26
-
27
-
28
-
29
-
30
-
31
-
32
-
33
-
34
-
35
-
36
-
37
-
38
-
39
-
40
-
41
-
42
-
43
-
44
-
45
-
46
-
47
-
48
-
49
-
50
-
51
-
52
-
53
-
54
-
55
-
56
-
57
-
58
-
59
-
60
-
61
-
62
-
63
-
64
-
65
-
66
-
67
-
68
-
 69
69 -
 70
70 -
 71
71 -
 72
72 -
 73
73 -
 74
74 -
 75
75 -
 76
76 -
 77
77 -
 78
78 -
 79
79 -
 80
80 -
 81
81 -
 82
82 -
 83
83 -
 84
84 -
 85
85 -
 86
86 -
 87
87 -
 88
88 -
 89
89 -
90
-
91
-
92
 |
 |

Chevron Corporation 2009 Annual Report 77
RAC subteams also conduct in-depth reviews during the year of many of the fields that have the largest proved reserves
quantities. These reviews include an examination of the proved-reserve records and documentation of their alignment with
the Corporate Reserves Manual.
Revised Oil and Gas Reporting In December 2008,
the SEC issued its final rule, Modernization of Oil and Gas
Reporting (Release Nos. 33-8995; 34-59192; FR-78). The dis-
closure requirements under the final rule became effective for
the company with its Form 10-K filing for the year ending
December 31, 2009. The final rule changes a number of oil
and gas reserve estimation and disclosure requirements under
SEC Regulations S-K and S-X. Subsequently, the FASB
updated Extractive Industries – Oil and Gas (Topic 932)
to align the oil and gas reserves estimation and disclosure
requirements with the SEC’s final rule.
Among the principal changes in the final rule are
requirements to use a price based on a 12-month average for
reserve estimation and disclosure instead of a single end-of-
year price; expanding the definition of oil and gas producing
activities to include nontraditional sources such as bitumen
extracted from oil sands; permitting the use of new reliable
technologies to establish reasonable certainty of proved
reserves; allowing optional disclosure of probable and pos-
sible reserves; modifying the definition of geographic area
for disclosure of reserve estimates and production; amending
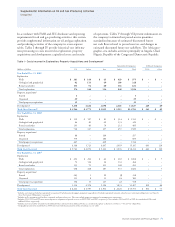
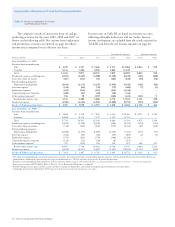
Table V Reserve Quantity Information – Continued
Summary of Net Oil and Gas Reserves
20091 20082 20072
Crude Oil Crude Oil Crude Oil
Liquids and Synthetic Oil in Millions of Barrels Condensate Synthetic Natural Condensate Natural Condensate Natural
Natural Gas in Billions of Cubic Feet NGLs Oil Gas NGLs Gas NGLs Gas
Proved Developed
Consolidated Companies
U.S. 1,122 – 2,314 1,158 2,709 1,238 3,226
Africa 820 – 978 789 1,209 758 1,151
Asia 926 – 5,062 1,094 4,758 722 4,344
Other 267 190 3,051 295 3,163 368 2,978
Total Consolidated 3,135 190 11,405 3,336 11,839 3,086 11,699
Affiliated Companies
TCO 1,256 – 1,830 1,369 1,999 1,273 1,762
Other 97 56 73 263 124 263 117
Total Consolidated and Affiliated Companies 4,488 246 13,308 4,968 13,962 4,622 13,578
Proved Undeveloped
Consolidated Companies
U.S. 239 – 384 312 441 386 451
Africa 426 – 2,043 596 1,847 742 1,898
Asia 245 – 2,798 362 3,238 301 2,863
Other 105 270 5,523 129 1,657 150 2,226
Total Consolidated 1,015 270 10,748 1,399 7,183 1,579 7,438
Affiliated Companies
TCO 690 – 1,003 807 1,176 716 986
Other 54 210 990 176 754 170 138
Total Consolidated and Affiliated Companies 1,759 480 12,741 2,382 9,113 2,465 8,562
Total Proved Reserves 6,247 726 26,049 7,350 23,075 7,087 22,140
1 Based on 12-month average price.
2 Based on year-end prices.
disclosures of proved reserve quantities to include separate
disclosures of synthetic oil and gas; expanding proved unde-
veloped reserves disclosures, including discussion of proved
undeveloped reserves that have remained undeveloped for five
years or more; and disclosure of the qualifications of the chief
technical person who oversees the company’s overall reserves
estimation process.
Effect of New Rules The most significant effect of the
company’s adopting the new guidance was the inclusion of
Canadian oil sands as synthetic oil in the consolidated
companies reserves. As indicated in Table V, on page 79,
an additional 460 million BOE were included at year-end
2009. The synthetic oil reported for affiliated companies
represents volumes reclassified from heavy crude oil to
synthetic oil, and does not represent additional reserves.
It was impracticable to estimate the remaining impact of
the new rules because of the cost and resources required
to prepare detailed field-level calculations. However, the
use of the 12-month average price had an upward effect on
reserves related to production-sharing and variable-royalty
contracts as the 12-month average price for crude oil and