Chevron 2009 Annual Report Download - page 19
Download and view the complete annual report
Please find page 19 of the 2009 Chevron annual report below. You can navigate through the pages in the report by either clicking on the pages listed below, or by using the keyword search tool below to find specific information within the annual report.-
 1
1 -
2
-
3
-
4
-
5
-
6
-
7
-
8
-
 9
9 -
 10
10 -
 11
11 -
 12
12 -
 13
13 -
 14
14 -
 15
15 -
 16
16 -
 17
17 -
 18
18 -
 19
19 -
 20
20 -
 21
21 -
 22
22 -
 23
23 -
 24
24 -
 25
25 -
 26
26 -
 27
27 -
 28
28 -
 29
29 -
30
-
31
-
32
-
33
-
34
-
35
-
36
-
37
-
38
-
39
-
40
-
41
-
42
-
43
-
44
-
45
-
46
-
47
-
48
-
49
-
50
-
51
-
52
-
53
-
54
-
55
-
56
-
57
-
58
-
59
-
60
-
61
-
62
-
63
-
64
-
65
-
66
-
67
-
68
-
69
-
70
-
71
-
72
-
73
-
74
-
75
-
76
-
77
-
78
-
79
-
80
-
81
-
82
-
83
-
84
-
85
-
86
-
87
-
88
-
89
-
90
-
91
-
92
 |
 |

Chevron Corporation 2009 Annual Report 17
FS-PB
that previously had been closed or sold, favorable foreign-cur-
rency effects and lower expenses for employee compensation
and benefits. Net charges in 2008 increased $1.4 billion from
2007. Results in 2008 included net unfavorable corporate
tax items and increased costs of environmental remediation.
Foreign-currency effects also contributed to the increase in
net charges from 2007 to 2008. Results in 2007 included a
$680 million gain on the sale of the company’s investment in
Dynegy common stock and a loss of approximately $175 mil-
lion associated with the early redemption of Texaco Capital
Inc. bonds.
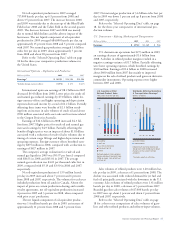
Consolidated Statement of Income
Comparative amounts for certain income statement catego-
ries are shown below:
Millions of dollars 2009 2008 2007
Sales and other operating revenues $ 167,402 $ 264,958 $ 214,091
Sales and other operating revenues decreased in 2009,
due mainly to lower prices for crude oil, natural gas and
refined products. Higher 2008 prices resulted in increased
revenues compared with 2007.
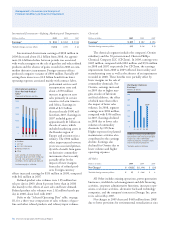
Millions of dollars 2009 2008 2007
Income from equity affiliates $ 3,316 $ 5,366 $ 4,144
Income from equity affiliates decreased in 2009 from
2008. Upstream-related affiliate income declined about
$1.3 billion mainly due to lower earnings for Tengizchevroil
(TCO) in Kazakhstan as a result of lower prices for crude oil.
Downstream-related affiliate earnings were lower by approxi-
mately $1.0 billion primarily due to weaker margins and an
unfavorable swing in foreign-currency effects. Income from
equity affiliates increased in 2008 from 2007 largely due
to improved upstream-related earnings at TCO as a result
of higher prices for crude oil. Refer to Note 12, beginning
on page 50, for a discussion of Chevron’s investments in
affiliated companies.
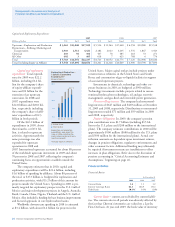
Millions of dollars 2009 2008 2007
Other income $ 918 $ 2,681 $ 2,669
Other income of $918 million in 2009 included gains of
approximately $1.3 billion on asset sales. Other income of
$2.7 billion in 2008 and 2007 included net gains from asset
sales of $1.3 billion and $1.7 billion, respectively. Interest
income was approximately $95 million in 2009, $340 mil-
lion in 2008 and $600 million in 2007. Foreign-currency
effects reduced other income by $466 million in 2009 while
increasing other income by $355 million in 2008 and reduc-
ing other income by $352 million in 2007. In addition, other
income in 2008 included approximately $700 million in
favorable settlements and other items.
Millions of dollars 2009 2008 2007
Purchased crude oil and products $ 99,653 $ 171,397 $ 133,309
Crude oil and product purchases in 2009 decreased
$71.7 billion from 2008 due to lower prices for crude oil,
natural gas and refined products. Crude oil and product
purchases in 2008 increased $38.1 billion from 2007 due to
higher prices for crude oil, natural gas and refined products.
Millions of dollars 2009 2008 2007
Operating, selling, general and
administrative expenses $ 22,384 $ 26,551 $ 22,858
Operating, selling, general and administrative expenses
in 2009 decreased approximately $4.2 billion from 2008
primarily due to $1.4 billion of lower fuel and transporta-
tion expenses; $800 million of decreased costs for contract
labor and professional services; absence of uninsured 2008
hurricane-related charges of $700 million; a decrease of
about $500 million for environmental remediation activities;
$200 million of lower costs for materials; and $600 million
for other items. Total expenses for 2008 were about $3.7
billion higher than 2007 primarily due to $1.2 billion of
higher costs for employee and contract labor and professional
services; $600 million of increased transportation expenses;
$700 million of uninsured losses associated with hurricanes
in the Gulf of Mexico in 2008; an increase of about $300
million for environmental remediation activities; $200 mil-
lion from higher material expenses; and $700 million from
increases for other items.
Millions of dollars 2009 2008 2007
Exploration expense $ 1,342 $ 1,169 $ 1,323
Exploration expenses in 2009 increased from 2008 due
mainly to higher amounts for well write-offs in the United
States and international operations. Expenses in 2008
declined from 2007 mainly due to lower amounts for well
write-offs for operations in the United States.
Millions of dollars 2009 2008 2007
Depreciation, depletion and
amortization $ 12,110 $ 9,528 $ 8,708
Depreciation, depletion and amortization expenses
increased in 2009 from 2008 due to incremental production
related to start-ups for upstream projects in the United States
and Africa and higher depreciation rates for certain other oil
and gas producing fields. The increase in 2008 from 2007 was
largely due to higher depreciation rates for certain crude-oil and
natural-gas producing fields, reflecting completion of higher-
cost development projects and asset-retirement obligations.
Millions of dollars 2009 2008 2007
Taxes other than on income $ 17,591 $ 21,303 $ 22,266
Taxes other than on income decreased in 2009 from
2008 mainly due to lower import duties for the company’s
downstream operations in the United Kingdom. Taxes other
than on income decreased in 2008 from 2007 mainly due to
lower import duties as a result of the effects of the 2007 sales