Chevron 2009 Annual Report Download - page 62
Download and view the complete annual report
Please find page 62 of the 2009 Chevron annual report below. You can navigate through the pages in the report by either clicking on the pages listed below, or by using the keyword search tool below to find specific information within the annual report.-
 1
1 -
2
-
3
-
4
-
5
-
6
-
7
-
8
-
9
-
10
-
11
-
12
-
13
-
14
-
15
-
16
-
17
-
18
-
19
-
20
-
21
-
22
-
23
-
24
-
25
-
26
-
27
-
28
-
29
-
30
-
31
-
32
-
33
-
34
-
35
-
36
-
37
-
38
-
39
-
40
-
41
-
42
-
43
-
44
-
45
-
46
-
47
-
48
-
49
-
50
-
51
-
 52
52 -
 53
53 -
 54
54 -
 55
55 -
 56
56 -
 57
57 -
 58
58 -
 59
59 -
 60
60 -
 61
61 -
 62
62 -
 63
63 -
 64
64 -
 65
65 -
 66
66 -
 67
67 -
 68
68 -
 69
69 -
 70
70 -
 71
71 -
 72
72 -
73
-
74
-
75
-
76
-
77
-
78
-
79
-
80
-
81
-
82
-
83
-
84
-
85
-
86
-
87
-
88
-
89
-
90
-
91
-
92
 |
 |

60 Chevron Corporation 2009 Annual Report
FS-PB
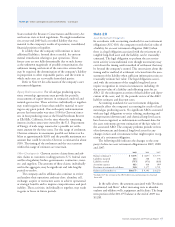
Note 21 Employee Benefit Plans – Continued
Pension Benefits
2009 2008 Other Benefits
U.S. Int’l. U.S. Int’l. 2009 2008
Change in Benefit Obligation
Benefit obligation at January 1 $ 8,127 $ 3,891 $ 8,395 $ 4,633 $ 2,931 $ 2,939
Service cost 266 128 250 132 43 44
Interest cost 481 292 499 292 180 178
Plan participants’ contributions – 7 – 9 145 152
Plan amendments 1 10 – 32 20 –
Curtailments – – – – (5) –
Actuarial loss (gain) 1,391 299 (62) (104) 56 (14)
Foreign currency exchange rate changes – 333 – (858) 27 (28)
Benefits paid (602) (245) (955) (246) (332) (340)
Special termination benefits – – – 1 – –
Benefit obligation at December 31 9,664 4,715 8,127 3,891 3,065 2,931
Change in Plan Assets
Fair value of plan assets at January 1 5,448 2,600 7,918 3,892 – –
Actual return on plan assets 964 402 (2,092) (655) – –
Foreign currency exchange rate changes – 226 – (662) – –
Employer contributions 1,494 245 577 262 187 188
Plan participants’ contributions – 7 – 9 145 152
Benefits paid (602) (245) (955) (246) (332) (340)
Fair value of plan assets at December 31 7,304 3,235 5,448 2,600 – –
Funded Status at December 31 $ (2,360) $ (1,480) $ (2,679) $ (1,291) $ (3,065) $ (2,931)
Amounts recognized on the Consolidated Balance Sheet for the company’s pension and other postretirement benefit plans at
December 31, 2009 and 2008, include:
Pension Benefits
2009 2008 Other Benefits
U.S. Int’l. U.S. Int’l. 2009 2008
Deferred charges and other assets $ 6 $ 37 $ 6 $ 31 $ – $ –
Accrued liabilities (66) (67) (72) (61) (208) (209)
Reserves for employee benefit plans (2,300) (1,450) (2,613) (1,261) (2,857) (2,722)
Net amount recognized at December 31 $ (2,360) $ (1,480) $ (2,679) $ (1,291) $ (3,065) $ (2,931)
Amounts recognized on a before-tax basis in “Accumulated other comprehensive loss” for the company’s pension and OPEB
plans were $6,454 and $5,831 at the end of 2009 and 2008, respectively. These amounts consisted of:
Pension Benefits
2009 2008 Other Benefits
U.S. Int’l. U.S. Int’l. 2009 2008
Net actuarial loss $ 4,181 $ 1,889 $ 3,797 $ 1,804 $ 465 $ 410
Prior-service (credit) costs (60) 201 (68) 211 (222) (323)
Total recognized at December 31 $ 4,121 $ 2,090 $ 3,729 $ 2,015 $ 243 $ 87
The accumulated benefit obligations for all U.S. and international pension plans were $8,707 and $4,029, respectively, at
December 31, 2009, and $7,376 and $3,273, respectively, at December 31, 2008.
Information for U.S. and international pension plans with an accumulated benefit obligation in excess of plan assets at
December 31, 2009 and 2008, was:
Pension Benefits
2009 2008
U.S. Int’l. U.S. Int’l.
Projected benefit obligations $ 9,658 $ 3,550 $ 8,121 $ 2,906
Accumulated benefit obligations 8,702 3,102 7,371 2,539
Fair value of plan assets 7,292 2,116 5,436 1,698
Notes to the Consolidated Financial Statements
Millions of dollars, except per-share amounts