Chevron 2009 Annual Report Download - page 74
Download and view the complete annual report
Please find page 74 of the 2009 Chevron annual report below. You can navigate through the pages in the report by either clicking on the pages listed below, or by using the keyword search tool below to find specific information within the annual report.-
 1
1 -
2
-
3
-
4
-
5
-
6
-
7
-
8
-
9
-
10
-
11
-
12
-
13
-
14
-
15
-
16
-
17
-
18
-
19
-
20
-
21
-
22
-
23
-
24
-
25
-
26
-
27
-
28
-
29
-
30
-
31
-
32
-
33
-
34
-
35
-
36
-
37
-
38
-
39
-
40
-
41
-
42
-
43
-
44
-
45
-
46
-
47
-
48
-
49
-
50
-
51
-
52
-
53
-
54
-
55
-
56
-
57
-
58
-
59
-
60
-
61
-
62
-
63
-
 64
64 -
 65
65 -
 66
66 -
 67
67 -
 68
68 -
 69
69 -
 70
70 -
 71
71 -
 72
72 -
 73
73 -
 74
74 -
 75
75 -
 76
76 -
 77
77 -
 78
78 -
 79
79 -
 80
80 -
 81
81 -
 82
82 -
 83
83 -
 84
84 -
85
-
86
-
87
-
88
-
89
-
90
-
91
-
92
 |
 |

FS-PB
72 Chevron Corporation 2009 Annual Report
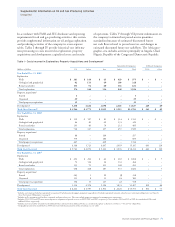
Supplemental Information on Oil and Gas Producing Activities
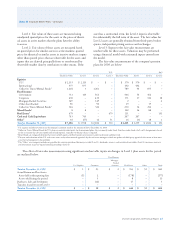
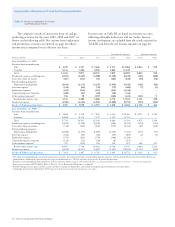
Table II – Capitalized Costs Related to Oil and Gas Producing Activities
Consolidated Companies Affiliated Companies
Millions of dollars U.S. Africa Asia Other Total TCO Other
At Dec. 31, 2009
Unproved properties $ 2,320 $ 321 $ 3,355 $ 963 $ 6,959 $ 113 $ –
Proved properties and related producing assets 51,582 20,967 29,637 17,267 119,453 6,404 1,759
Support equipment 810 1,012 1,383 648 3,853 947 –
Deferred exploratory wells 762 603 209 861 2,435 – –
Other uncompleted projects 2,384 3,960 2,936 5,572 14,852 284 58
Gross Capitalized Costs 57,858 26,863 37,520 25,311 147,552 7,748 1,817
Unproved properties valuation 915 163 170 390 1,638 32 –
Proved producing properties –
Depreciation and depletion 34,574 8,823 15,783 11,243 70,423 1,150 282
Support equipment depreciation 424 526 773 357 2,080 356 –
Accumulated provisions 35,913 9,512 16,726 11,990 74,141 1,538 282
Net Capitalized Costs1 $ 21,945 $ 17,351 $ 20,794 $ 13,321 $ 73,411 $ 6,210 $ 1,535
At Dec. 31, 20082,3
Unproved properties $ 2,495 $ 294 $ 3,300 $ 1,051 $ 7,140 $ 113 $ –
Proved properties and related producing assets 46,280 17,495 27,607 15,277 106,659 5,991 837
Support equipment 717 967 1,321 570 3,575 888 –
Deferred exploratory wells 602 499 198 819 2,118 – –
Other uncompleted projects 4,275 4,226 2,461 2,643 13,605 501 101
Gross Capitalized Costs 54,369 23,481 34,887 20,360 133,097 7,493 938
Unproved properties valuation 845 202 150 576 1,773 29 –
Proved producing properties –
Depreciation and depletion 30,780 6,602 13,617 9,649 60,648 831 163
Support equipment depreciation 382 523 690 356 1,951 307 –
Accumulated provisions 32,007 7,327 14,457 10,581 64,372 1,167 163
Net Capitalized Costs $ 22,362 $ 16,154 $ 20,430 $ 9,779 $ 68,725 $ 6,326 $ 775
1 Includes net capitalized cost for oil sands in consolidated Other and heavy oil in affiliated Other as a result of the update to Extractive Industries — Oil and Gas (Topic 932).
2 Geographic presentation conformed to 2009 consistent with the presentation of the oil and gas reserve tables.
3 Amounts for Affiliated Companies – Other conformed to agreements entered in 2007 and 2008 for Venezuelan affiliates.
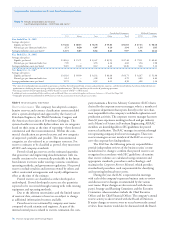
of the Congo. The Asia geographic area includes activities
principally in Azerbaijan, Bangladesh, China, Indonesia,
Kazakhstan, Myanmar, the Partitioned Zone between Kuwait
and Saudi Arabia, the Philippines, and Thailand. The Other
geographic regions include activities in Argentina, Australia,
Brazil, Canada, Colombia, Denmark, the Netherlands,
Norway, Trinidad and Tobago, the United Kingdom,
Venezuela and other countries. Amounts for TCO repre-
sent Chevron’s 50 percent equity share of Tengizchevroil, an
exploration and production partnership in the Republic of
Kazakhstan. The affiliated companies Other amounts are
composed of the company’s equity interests in Venezuela and
Angola. Refer to Note 12, beginning on page 50, for a dis-
cussion of the company’s major equity affiliates.
Table II Capitalized Costs Related to Oil and
Gas Producing Activities