Chevron 2009 Annual Report Download - page 47
Download and view the complete annual report
Please find page 47 of the 2009 Chevron annual report below. You can navigate through the pages in the report by either clicking on the pages listed below, or by using the keyword search tool below to find specific information within the annual report.-
 1
1 -
2
-
3
-
4
-
5
-
6
-
7
-
8
-
9
-
10
-
11
-
12
-
13
-
14
-
15
-
16
-
17
-
18
-
19
-
20
-
21
-
22
-
23
-
24
-
25
-
26
-
27
-
28
-
29
-
30
-
31
-
32
-
33
-
34
-
35
-
36
-
 37
37 -
 38
38 -
 39
39 -
 40
40 -
 41
41 -
 42
42 -
 43
43 -
 44
44 -
 45
45 -
 46
46 -
 47
47 -
 48
48 -
 49
49 -
 50
50 -
 51
51 -
 52
52 -
 53
53 -
 54
54 -
 55
55 -
 56
56 -
 57
57 -
58
-
59
-
60
-
61
-
62
-
63
-
64
-
65
-
66
-
67
-
68
-
69
-
70
-
71
-
72
-
73
-
74
-
75
-
76
-
77
-
78
-
79
-
80
-
81
-
82
-
83
-
84
-
85
-
86
-
87
-
88
-
89
-
90
-
91
-
92
 |
 |

Chevron Corporation 2009 Annual Report 45
FS-PB
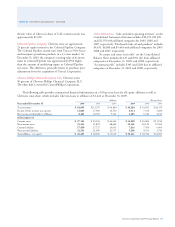
Note 7 Summarized Financial Data — Tengizchevroil LLP – Continued
Level 3: Unobservable inputs. The company does not use Level 3 inputs for any of its recurring fair-value measure-
ments. Level 3 inputs may be required for the determination of fair value associated with certain nonrecurring
measurements of nonfinancial assets and liabilities. In 2009, the company used Level 3 inputs to determine the fair
value of certain nonrecurring nonfinancial assets.
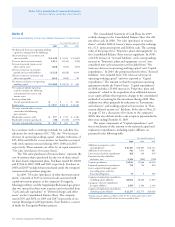
The fair-value hierarchy for recurring assets and liabilities measured at fair value at December 31, 2009, and December 31,
2008, is as follows:
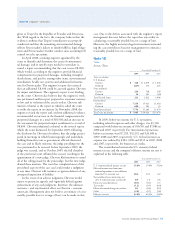
Note 9 Fair Value Measurements – Continued
Marketable Securities The company calculates fair value for
its marketable securities based on quoted market prices for
identical assets and liabilities. The fair values reflect the cash
that would have been received if the instruments were sold
at December 31, 2009. Marketable securities had average
maturities of less than one year.
Derivatives The company records its derivative instruments –
other than any commodity derivative contracts that are
designated as normal purchase and normal sale – on the Con-
solidated Balance Sheet at fair value, with virtually all the
offsetting amount to the Consolidated Statement of Income.
For derivatives with identical or similar provisions as contracts
that are publicly traded on a regular basis, the company uses
the market values of the publicly traded instruments as an
input for fair-value calculations.
The company’s derivative instruments principally
include crude-oil, natural-gas and refined-product futures,
swaps, options and forward contracts. Derivatives classified as
Level 1 include futures, swaps and options contracts traded
in active markets such as the New York Mercantile Exchange.
Derivatives classified as Level 2 include swaps, options,
and forward contracts principally with financial institutions
and other oil and gas companies, the fair values for which
are obtained from third-party broker quotes, industry pric-
ing services and exchanges. The company obtains multiple
sources of pricing information for the Level 2 instruments.
Since this pricing information is generated from observable
market data, it has historically been very consistent. The
company does not materially adjust this information. The
company incorporates internal review, evaluation and assess-
ment procedures, including a comparison of Level 2 fair
values derived from the company’s internally developed for-
ward curves (on a sample basis) with the pricing information
to document reasonable, logical and supportable fair-value
determinations and proper level of classification.
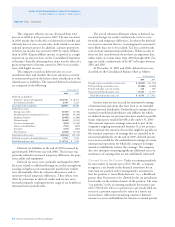
Impairments of “Properties, plant and equipment” During
2009 and in accordance with the accounting standard for
the impairment or disposal of long-lived assets (ASC 360),
long-lived assets “held and used” with a carrying amount of
$949 were written down to a fair value of $490, resulting in
a before-tax loss of $459. The fair values were determined
from internal cash-flow models, using discount rates consis-
tent with those used by the company to evaluate cash flows
of other assets of a similar nature. Long-lived assets “held for
sale” with a carrying amount of $160 were written down to
a fair value of $68, resulting in a before-tax loss of $92. The
fair values were determined based on bids received from pro-
spective buyers.
Assets and Liabilities Measured at Fair Value on a Recurring Basis
Prices in Active Prices in Active
Markets for Other Markets for Other
Identical Observable Unobservable Identical Observable Unobservable
At December 31 Assets/Liabilities Inputs Inputs At December 31 Assets/Liabilities Inputs Inputs
2009 (Level 1) (Level 2) (Level 3) 2008 (Level 1) (Level 2) (Level 3)
Marketable Securities $ 106 $ 106 $ – $ – $ 213 $ 213 $ – $ –
Derivatives 127 14 113 – 805 529 276 –
Total Recurring Assets
at Fair Value $ 233 $ 120 $ 113 $ – $ 1,018 $ 742 $ 276 $ –
Derivatives $ 101 $ 20 $ 81 $ – $ 516 $ 98 $ 418 $ –
Total Recurring Liabilities
at Fair Value $ 101 $ 20 $ 81 $ – $ 516 $ 98 $ 418 $ –