Chevron 2009 Annual Report Download - page 56
Download and view the complete annual report
Please find page 56 of the 2009 Chevron annual report below. You can navigate through the pages in the report by either clicking on the pages listed below, or by using the keyword search tool below to find specific information within the annual report.-
 1
1 -
2
-
3
-
4
-
5
-
6
-
7
-
8
-
9
-
10
-
11
-
12
-
13
-
14
-
15
-
16
-
17
-
18
-
19
-
20
-
21
-
22
-
23
-
24
-
25
-
26
-
27
-
28
-
29
-
30
-
31
-
32
-
33
-
34
-
35
-
36
-
37
-
38
-
39
-
40
-
41
-
42
-
43
-
44
-
45
-
 46
46 -
 47
47 -
 48
48 -
 49
49 -
 50
50 -
 51
51 -
 52
52 -
 53
53 -
 54
54 -
 55
55 -
 56
56 -
 57
57 -
 58
58 -
 59
59 -
 60
60 -
 61
61 -
 62
62 -
 63
63 -
 64
64 -
 65
65 -
 66
66 -
67
-
68
-
69
-
70
-
71
-
72
-
73
-
74
-
75
-
76
-
77
-
78
-
79
-
80
-
81
-
82
-
83
-
84
-
85
-
86
-
87
-
88
-
89
-
90
-
91
-
92
 |
 |

54 Chevron Corporation 2009 Annual Report
FS-PB
The company’s effective tax rate decreased from 44.2
percent in 2008 to 43.0 percent in 2009. The rate was lower
in 2009 mainly due to the effect of deferred tax benefits and
relatively low tax rates on asset sales, both related to an inter-
national upstream project. In addition, a greater proportion
of before-tax income was earned in 2009 by equity affiliates
than in 2008. (Equity-affiliate income is reported as a single
amount on an after-tax basis on the Consolidated Statement
of Income.) Partially offsetting these items was the effect of a
greater proportion of income earned in 2009 in tax jurisdic-
tions with higher tax rates.
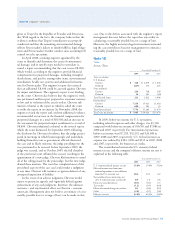
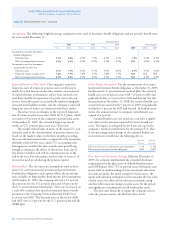
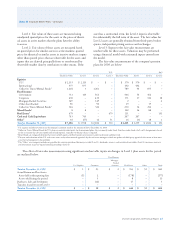
The company records its deferred taxes on a tax-
jurisdiction basis and classifies those net amounts as current
or noncurrent based on the balance sheet classification of the
related assets or liabilities. The reported deferred tax balances
are composed of the following:
At December 31
2009 2008
Deferred tax liabilities
Properties, plant and equipment $ 18,545 $ 18,271
Investments and other 2,350 2,225
Total deferred tax liabilities 20,895 20,496
Deferred tax assets
Foreign tax credits (5,387) (4,784)
Abandonment/environmental reserves (4,424) (4,338)
Employee benefits (3,499) (3,488)
Deferred credits (3,469) (3,933)
Tax loss carryforwards (819) (1,139)
Other accrued liabilities (553) (445)
Inventory (431) (260)
Miscellaneous (1,681) (1,732)
Total deferred tax assets (20,263) (20,119)
Deferred tax assets valuation allowance 7,921 7,535
Total deferred taxes, net $ 8,553 $ 7,912
Deferred tax liabilities at the end of 2009 increased by
approximately $400 from year-end 2008. The increase was
primarily related to increased temporary differences for prop-
erties, plant and equipment.
Deferred tax assets were essentially unchanged in 2009.
Increases related to additional foreign tax credits arising from
earnings in high-tax-rate international jurisdictions (which
were substantially offset by valuation allowances) and to
inventory-related temporary differences. These effects were
offset by reductions in deferred credits and tax loss carry-
forwards primarily resulting from the usage of tax benefits in
international tax jurisdictions.
The overall valuation allowance relates to deferred tax
assets for foreign tax credit carryforwards, tax loss carry-
forwards and temporary differences. It reduces the deferred
tax assets to amounts that are, in management’s assessment,
more likely than not to be realized. Tax loss carryforwards
exist in many international jurisdictions. Whereas some of
these tax loss carryforwards do not have an expiration date,
others expire at various times from 2010 through 2036. For-
eign tax credit carryforwards of $5,387 will expire between
2010 and 2019.
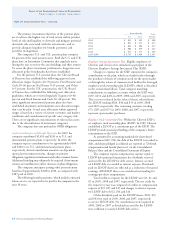
At December 31, 2009 and 2008, deferred taxes were
classified on the Consolidated Balance Sheet as follows:
At December 31
2009 2008
Prepaid expenses and other current assets $ (1,825) $ (1,130)
Deferred charges and other assets (1,268) (2,686)
Federal and other taxes on income 125 189
Noncurrent deferred income taxes 11,521 11,539
Total deferred income taxes, net $ 8,553 $ 7,912
Income taxes are not accrued for unremitted earnings
of international operations that have been or are intended
to be reinvested indefinitely. Undistributed earnings of inter-
national consolidated subsidiaries and affiliates for which
no deferred income tax provision has been made for possible
future remittances totaled $20,458 at December 31, 2009.
This amount represents earnings reinvested as part of the
company’s ongoing international business. It is not practica-
ble to estimate the amount of taxes that might be payable on
the eventual remittance of earnings that are intended to be
reinvested indefinitely. At the end of 2009, deferred income
taxes were recorded for the undistributed earnings of certain
international operations for which the company no longer
intends to indefinitely reinvest the earnings. The company
does not anticipate incurring significant additional taxes on
remittances of earnings that are not indefinitely reinvested.
Uncertain Income Tax Positions Under accounting standards
for uncertainty in income taxes (ASC 740-10), a company
recognizes a tax benefit in the financial statements for an
uncertain tax position only if management’s assessment is
that the position is “more likely than not” (i.e., a likelihood
greater than 50 percent) to be allowed by the tax jurisdiction
based solely on the technical merits of the position. The term
“tax position” in the accounting standards for income taxes
(ASC 740-10-20) refers to a position in a previously filed tax
return or a position expected to be taken in a future tax
return that is reflected in measuring current or deferred
income tax assets and liabilities for interim or annual periods.
Note 15 Taxes – Continued
Notes to the Consolidated Financial Statements
Millions of dollars, except per-share amounts