Chevron 2009 Annual Report Download - page 21
Download and view the complete annual report
Please find page 21 of the 2009 Chevron annual report below. You can navigate through the pages in the report by either clicking on the pages listed below, or by using the keyword search tool below to find specific information within the annual report.-
 1
1 -
2
-
3
-
4
-
5
-
6
-
7
-
8
-
9
-
10
-
 11
11 -
 12
12 -
 13
13 -
 14
14 -
 15
15 -
 16
16 -
 17
17 -
 18
18 -
 19
19 -
 20
20 -
 21
21 -
 22
22 -
 23
23 -
 24
24 -
 25
25 -
 26
26 -
 27
27 -
 28
28 -
 29
29 -
 30
30 -
 31
31 -
32
-
33
-
34
-
35
-
36
-
37
-
38
-
39
-
40
-
41
-
42
-
43
-
44
-
45
-
46
-
47
-
48
-
49
-
50
-
51
-
52
-
53
-
54
-
55
-
56
-
57
-
58
-
59
-
60
-
61
-
62
-
63
-
64
-
65
-
66
-
67
-
68
-
69
-
70
-
71
-
72
-
73
-
74
-
75
-
76
-
77
-
78
-
79
-
80
-
81
-
82
-
83
-
84
-
85
-
86
-
87
-
88
-
89
-
90
-
91
-
92
 |
 |
Chevron Corporation 2009 Annual Report 19
FS-PB
Liquidity and Capital Resources
Cash, cash equivalents and marketable securities Total balances
were $8.8 billion and $9.6 billion at December 31, 2009 and
2008, respectively. Cash provided by operating activities in
2009 was $19.4 billion, compared with $29.6 billion in 2008
and $25.0 billion in 2007.
Cash provided by operating activities was net of contribu-
tions to employee pension plans of approximately $1.7 billion,
$800 million and $300 million in 2009, 2008 and 2007,
respectively. Cash provided by investing activities included
proceeds and deposits related to asset sales of $2.6 billion in
2009, $1.5 billion in 2008 and $3.3 billion in 2007.
Restricted cash of $123 million and $367 million associ-
ated with various capital-investment projects at December 31,
2009 and 2008, respectively, was invested in short-term mar-
ketable securities and recorded as “Deferred charges and other
assets” on the Consolidated Balance Sheet.
Dividends Dividends paid to common stockholders were
approximately $5.3 billion in 2009, $5.2 billion in 2008 and
$4.8 billion in 2007. In July 2009, the company increased
its quarterly common stock dividend by 4.6 percent to $0.68
per share.
Debt and capital lease obligations Total debt and capital
lease obligations were $10.5 billion at December 31, 2009,
up from $8.9 billion at year-end 2008.
The $1.6 billion increase in total debt and capital lease
obligations during 2009 included the net effect of a $5 billion
public bond issuance, a $350 million issuance of tax-exempt
Gulf Opportunity Zone bonds, a $3.2 billion decrease in
commercial paper, and a $400 million payment of principal
for Texaco Capital Inc. bonds that matured in January 2009.
The company’s debt and capital lease obligations due within
one year, consisting primarily of commercial paper and the
current portion of long-term debt, totaled $4.6 billion at
December 31, 2009, down from $7.8 billion at year-end 2008.
Of these amounts, $4.2 billion and $5.0 billion were reclas-
sified to long-term at the end of each period, respectively.
At year-end 2009, settlement of these obligations was not
expected to require the use of working capital in 2010, as the
company had the intent and the ability, as evidenced by com-
mitted credit facilities, to refinance them on a long-term basis.
At year-end 2009, the company had $5.1 billion in
committed credit facilities with various major banks,
which permit the refinancing of short-term obligations
on a long-term basis. These facilities support commercial
paper borrowing and also can be used for general corporate
purposes. The company’s practice has been to continually
replace expiring commitments with new commitments on
substantially the same terms, maintaining levels management
believes appropriate. Any borrowings under the facilities
would be unsecured indebtedness at interest rates based on
London Interbank Offered Rate or an average of base lend-
ing rates published by specified banks and on terms reflecting
the company’s strong credit rating. No borrowings were
outstanding under these facilities at December 31, 2009. In
addition, the company has an automatic shelf registration
statement that expires in March 2010 for an unspecified
amount of nonconvertible debt securities issued or guaran-
teed by the company. The company intends to file a new
shelf registration statement when the current one expires.
The company has outstanding public bonds issued by
Chevron Corporation, Chevron Corporation Profit Sharing/
Savings Plan Trust Fund, Texaco Capital Inc. and Union
Oil Company of California. All of these securities are the
obligations of, or guaranteed by, Chevron Corporation and
are rated AA by Standard and Poor’s Corporation and Aa1
by Moody’s Investors Service. The company’s U.S. com-
mercial paper is rated A-1+ by Standard and Poor’s and P-1
by Moody’s. All of these ratings denote high-quality, invest-
ment-grade securities.
The company’s future debt level is dependent primar-
ily on results of operations, the capital-spending program
and cash that may be generated from asset dispositions. The
company believes that it has substantial borrowing capacity to
meet unanticipated cash requirements and that during periods
of low prices for crude oil and natural gas and narrow margins
for refined products and commodity chemicals, it has the flex-
ibility to increase borrowings and/or modify capital-spending
plans to continue paying the common stock dividend and
maintain the company’s high-quality debt ratings.
Common stock repurchase program In September 2007,
the company authorized the acquisition of up to $15 billion
of its common shares at prevailing prices, as permitted by
securities laws and other legal requirements and subject to
market conditions and other factors. The program is for a
period of up to three years (expiring in 2010) and may be
discontinued at any time. The company did not acquire any
shares during 2009 and does not plan to acquire any shares
in the first quarter 2010. From the inception of the program,
the company has acquired 119 million shares at a cost of
$10.1 billion.
0.0
30.0
18.0
24.0
12.0
6.0
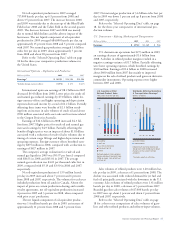
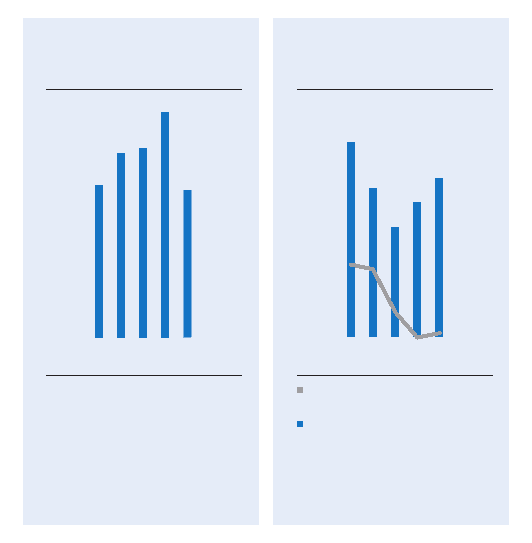
#022B – Cash Provided by Operating
Activities (back) – v3
Cash Provided by
Operating Activities
Billions of dollars
Operating cash flows were
approximately $10.3 billion lower
than 2008 due to lower crude oil
and natural gas prices.
0605 07 08 09
$19.4
0.0
15.0
12.0
3.0
6.0
9.0
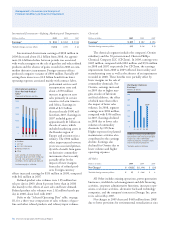
0.0
1.5
1.2
0.9
0.6
0.3
#023 – Total Interest Expense and
Total Debt at Year-End – v2
Total Interest Expense &
Total Debt at Year-End
Billions of dollars
Total Interest Expense
(right scale)
Total Debt (left scale)
Total debt increased $1.6 billion
during 2009 to $10.5 billion.
Essentially all of the interest was
capitalized as part of the cost of
major projects.
$10.5
0605 07 08 09