Chevron 2009 Annual Report Download - page 40
Download and view the complete annual report
Please find page 40 of the 2009 Chevron annual report below. You can navigate through the pages in the report by either clicking on the pages listed below, or by using the keyword search tool below to find specific information within the annual report.-
 1
1 -
2
-
3
-
4
-
5
-
6
-
7
-
8
-
9
-
10
-
11
-
12
-
13
-
14
-
15
-
16
-
17
-
18
-
19
-
20
-
21
-
22
-
23
-
24
-
25
-
26
-
27
-
28
-
29
-
 30
30 -
 31
31 -
 32
32 -
 33
33 -
 34
34 -
 35
35 -
 36
36 -
 37
37 -
 38
38 -
 39
39 -
 40
40 -
 41
41 -
 42
42 -
 43
43 -
 44
44 -
 45
45 -
 46
46 -
 47
47 -
 48
48 -
 49
49 -
 50
50 -
51
-
52
-
53
-
54
-
55
-
56
-
57
-
58
-
59
-
60
-
61
-
62
-
63
-
64
-
65
-
66
-
67
-
68
-
69
-
70
-
71
-
72
-
73
-
74
-
75
-
76
-
77
-
78
-
79
-
80
-
81
-
82
-
83
-
84
-
85
-
86
-
87
-
88
-
89
-
90
-
91
-
92
 |
 |

38 Chevron Corporation 2009 Annual Report
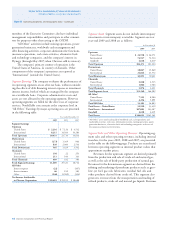
Consolidated Statement of Equity
Shares in thousands; amounts in millions of dollars
2009 2008 2007
Shares Amount Shares Amount Shares Amount
Preferred Stock – $ – – $ – – $ –
Common Stock 2,442,677 $ 1,832 2,442,677 $ 1,832 2,442,677 $ 1,832
Capital in Excess of Par
Balance at January 1 $ 14,448 $ 14,289 $ 14,126
Treasury stock transactions 183 159 163
Balance at December 31 $ 14,631 $ 14,448 $ 14,289
Retained Earnings
Balance at January 1 $ 101,102 $ 82,329 $ 68,464
Net income attributable to Chevron Corporation 10,483 23,931 18,688
Cash dividends on common stock (5,302) (5,162) (4,791)
Adoption of new accounting standard for uncertain
income tax positions – – (35)
Tax benefit from dividends paid on
unallocated ESOP shares and other 6 4 3
Balance at December 31
$ 106,289 $ 101,102 $ 82,329
Notes Receivable – Key Employees $ – $ – $ (1)
Accumulated Other Comprehensive Loss
Currency translation adjustment
Balance at January 1 $ (171) $ (59) $ (90)
Change during year 60 (112) 31
Balance at December 31 $ (111) $ (171) $ (59)
Pension and other postretirement benefit plans
Balance at January 1 $ (3,909) $ (2,008) $ (2,585)
Change to defined benefit plans during year (399) (1,901) 685
Adoption of new accounting standard
for defined benefit pension and other
postretirement plans – – (108)
Balance at December 31 $ (4,308) $ (3,909) $ (2,008)
Unrealized net holding gain on securities
Balance at January 1 $ 13 $ 19 $ –
Change during year 2 (6) 19
Balance at December 31 $ 15 $ 13 $ 19
Net derivatives gain (loss) on hedge transactions
Balance at January 1 $ 143 $ 33 $ 39
Change during year (60) 110 (6)
Balance at December 31 $ 83 $ 143 $ 33
Balance at December 31 $ (4,321) $ (3,924) $ (2,015)
Deferred Compensation and Benefit Plan Trust
Deferred Compensation
Balance at January 1 $ (194) $ (214) $ (214)
Net reduction of ESOP debt and other 85 20 –
Balance at December 31 (109) (194) (214)
Benefit Plan Trust (Common Stock) 14,168 (240) 14,168 (240) 14,168 (240)
Balance at December 31 14,168 $ (349) 14,168 $ (434) 14,168 $ (454)
Treasury Stock at Cost
Balance at January 1 438,445 $ (26,376) 352,243 $ (18,892) 278,118 $ (12,395)
Purchases 85 (6) 95,631 (8,011) 85,429 (7,036)
Issuances – mainly employee benefit plans (3,575) 214 (9,429) 527 (11,304) 539
Balance at December 31 434,955 $ (26,168) 438,445 $ (26,376) 352,243 $ (18,892)
Total Chevron Corporation Stockholders’ Equity $ 91,914 $ 86,648 $ 77,088
at December 31
Noncontrolling Interests
$ 647 $ 469 $ 204
Total E quit y $ 92,561 $ 87,117 $ 7 7, 292
See accompanying Notes to the Consolidated Financial Statements.